
Foot-traffic analytics
See where footfall is up, and where it is down.
Attach the counts from your street sensors or door counters, and where each one is. You get a map of which streets are up and which are down.
Free to start. Reports on a paid seat.
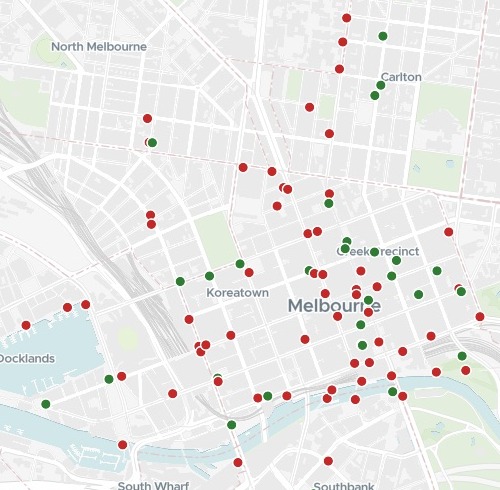
| Average day, October against October | Sensors |
|---|---|
| Down | 62 |
| Up | 32 |
Falls across most of the city grid and Docklands; rises in Carlton and scattered through the centre.
For whoever looks after a place
A city centre.A high street.A business district.The counters count all year.
The question is what changed, and where.
Footfall is the number of people passing a point. Street sensors and door counters record it hour by hour, which makes a file far too long to compare by eye.
Here you attach the pedestrian counts and the list of where each counter is. Mapstack compares each one’s average day year on year, and maps the streets that are up and the streets that are down.
One real city
94 street sensors, October against October
The City of Melbourne's public pedestrian counting sensors, hour by hour, for October 2025 and October 2026, with the city's list of where each sensor stands, compared for a briefing to the precinct managers on how foot traffic has changed.
- The rule
- 16 daysof counting in both months, or a sensor was left out
- Counted
- 27,557,855pedestrians counted by those sensors in October 2026, against 28,673,445 a year before
- Across the city
- −3.89%the change in that total count, year on year
| Sensor | Change | Daily, 2026 |
|---|---|---|
| Lygon St (East) | +82.01% | 1,788 |
| Pumping Station No.2, 330 Macaulay Road | +52.78% | 1,734 |
| Westwood Place | +39.17% | 687 |
| NAB Building, towards the city | +25.75% | 2,053 |
| Birrarung Marr East, Batman Ave Bridge Entry | +24.40% | 1,455 |
| Melbourne Convention Exhibition Centre | −30.77% | 17,544 |
| Near Federation Square Bridge | −29.93% | 2,876 |
| QV Market, Peel St | −28.28% | 3,548 |
| QV Market, Franklin St (North) | −25.35% | 2,427 |
| Docklands, Waterfront City Building Side | −24.02% | 3,009 |
It names the rule it used.
A sensor counting on fewer than 16 days in either month was left out, so a counter that was down for a fortnight cannot pass for a fall. The reply gave last October’s average day beside each: the Convention Centre fell from 25,342 a day to 17,544.
City of Melbourne Open Data: Pedestrian Counting System, counts per hour, 1 to 31 October 2025 and 2026; Pedestrian Counting System, sensor locations. CC BY. Run on 14 November 2026.
How it goes
You bring the counts. Mapstack does the comparing.
Attach the counts and the list of where each counter is.
Mapstack maps what moved, up in green and down in red.
You open any sensor for its figures. Here, Lygon St (East).
Common questions
What do I need?
The counts. From street sensors or door counters, with a date and a counter on every row.
Where each counter is. A list with the same counter names or codes, and a location for each.
Two periods to compare. A month against the same month a year before, as here.
What happens to our counts?
It stays in your workspace. Only people with a seat in your workspace can see it. Nothing leaves unless you publish it yourself.
It is not used to train AI. Your data and your conversations are not used to train AI models.
It is still yours. You keep ownership of what you bring in. Delete it and it is removed.
The full answer is in the documentation: Your data, privacy and security.
What does it cost?
Free to start. One seat, for you, with a starter amount of work each month. No card.
The comparison and the map are on the free seat. With your own files and public sharing.
A briefing report is on a paid seat. Paid seats are per person, and bring more work each month.
The prices are on the pricing page.
Compare yours.
Free to start. Reports on a paid seat.