
Mapstack for retail
The AI teammate for retail location analysis.
Ask in plain words. Mapstack makes the trade area, the comparison or the report.
Free to start. No card.
Where retail stands today
Every decision about where to trade has location work behind it. Getting that work done is the slow part.
Everyone needs it, few can do it
Sites, closures, relocations and territories come from dealmakers, franchisees, operations and finance. They land on a few analysts, or on the real estate team itself.
Opening and closing at once
Chains are opening and closing in the same year, and good space is scarce. The work on a site and the work on the network run side by side.
Every number gets challenged
A committee, an owner, a lender or a franchisee will ask where each figure came from. The work has to show it.
Evidence for every opening, closure and move.
What changes with Mapstack
Today the maps, the counts and the layout are rebuilt by hand for each site, and the person who brought it waits. With Mapstack, they ask and have the answer while the site is still available.
Know what surrounds a site before you commit to it
Draw a trade area around any location by drive time, walk time or distance, and count the households, the competitors and your own units inside it.
- Or ask
What is the drive to our next-nearest branch if this one closes?
How many households and competitors are within 10, 15 and 20 minutes of this site?
New clinic, Southlake Town Square: drive-time reach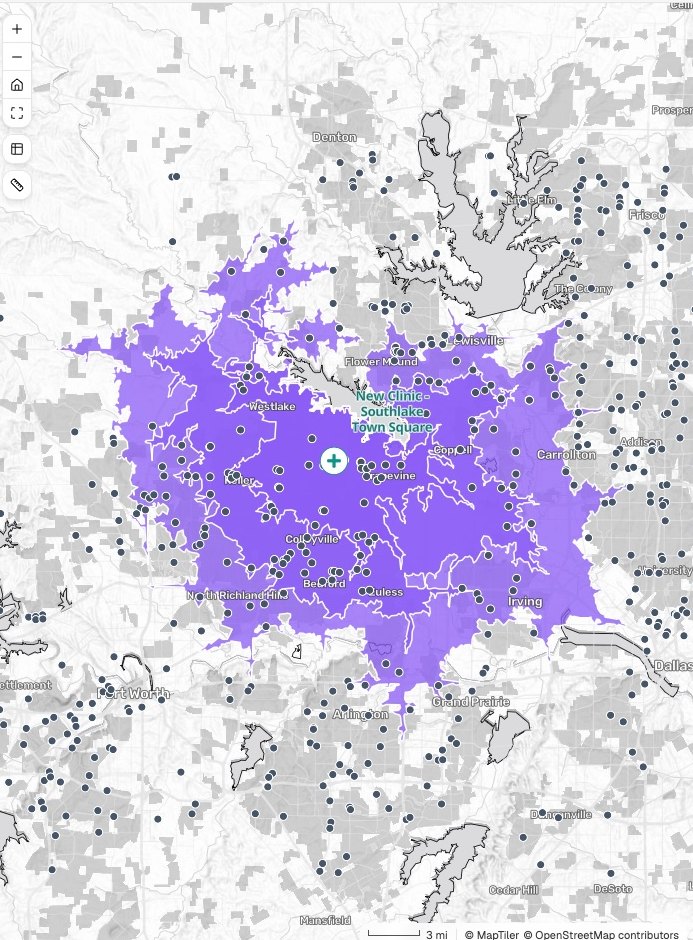
- Or ask
See what one change does to the whole network
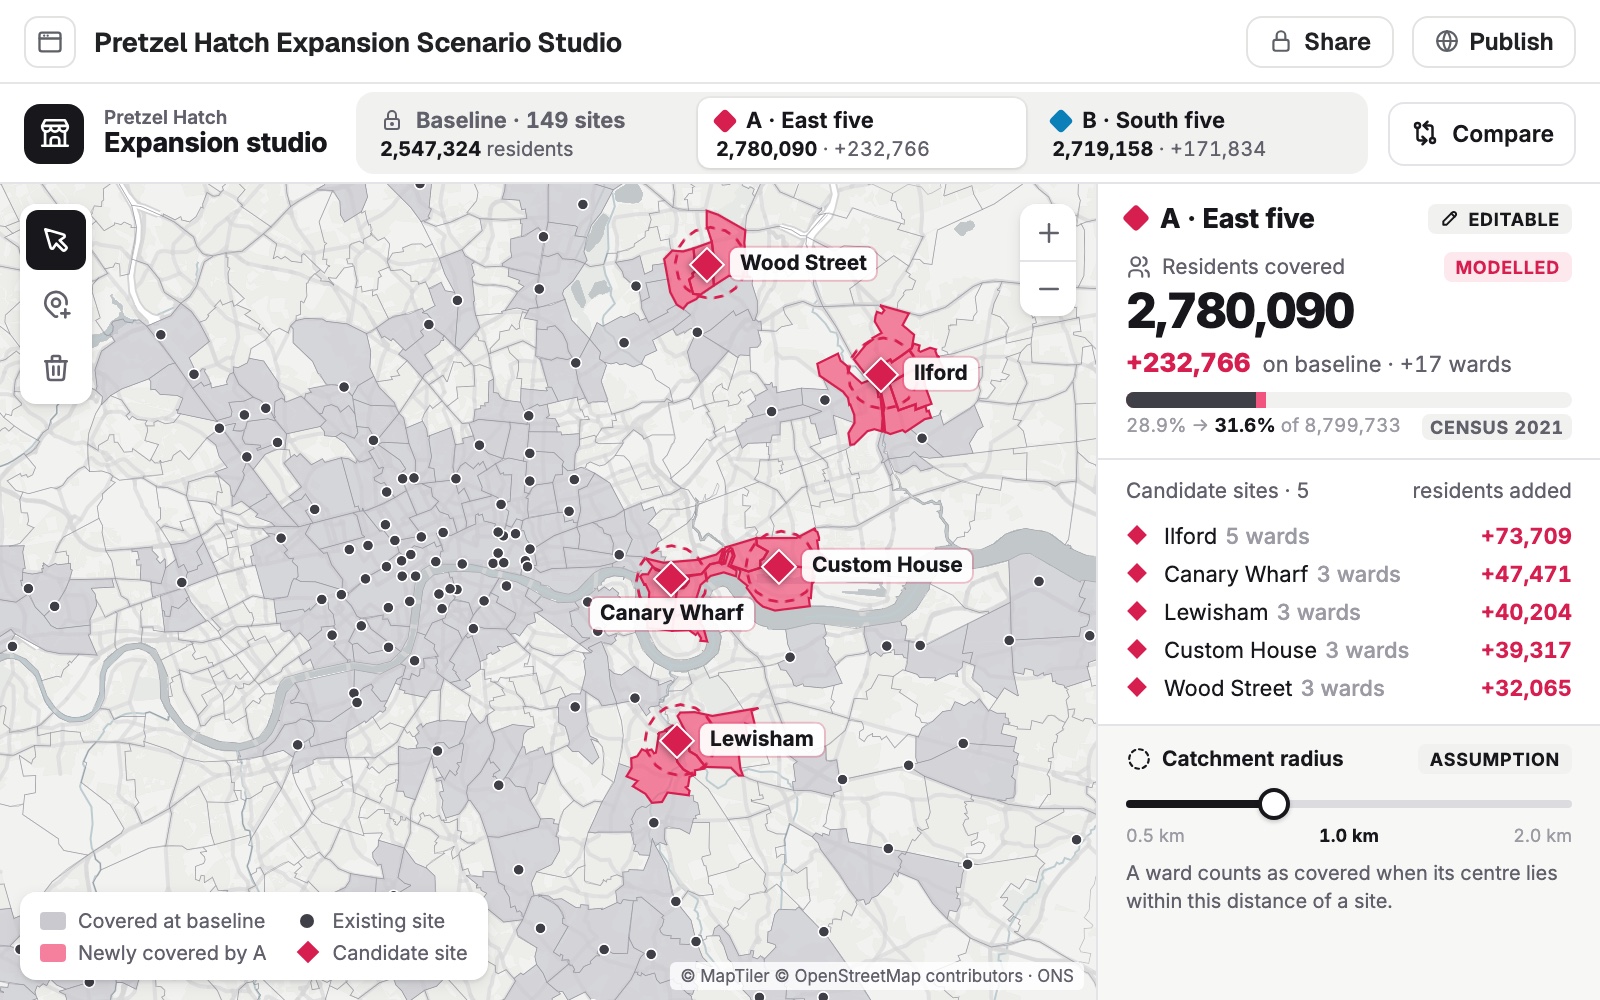
Set your units against the people around them: where the white space is, how much two trade areas share, and what an opening or a closure would add or leave uncovered.
- Or ask
Where are there 20,000 households and no store of ours within 10 minutes?
What would each of these five candidate sites add to our coverage?
- Or ask
Put your own records on the map, with the market around each
Store lists, sales by store and customer files are placed, counted by area and matched to census figures. The list comes back with the new columns, and the rows that did not match.
- Or ask
Which ZIP codes do our loyalty members come from, and where do they thin out?
Add the median household income around every store on this list.
A store list in Denver, by census tract income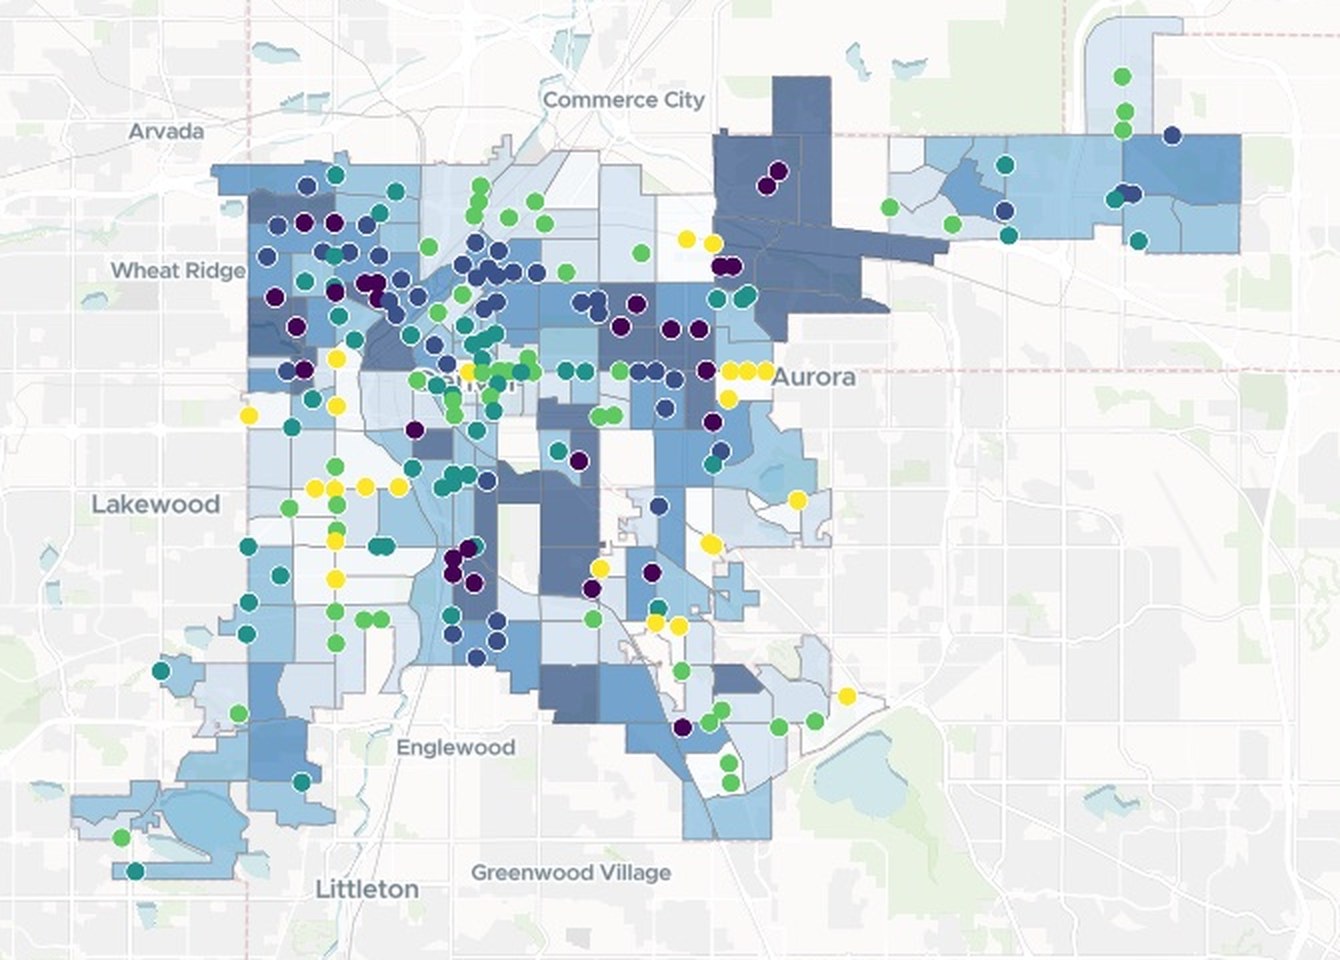
- Or ask
Put it in front of whoever signs off, with the working shown
A print sheet to scale, a written report or a shared map people can open and question. Each carries its sources, its dates and its method, and can be made again on new figures.
- Or ask
Write up the branch comparison as a short briefing for the board.
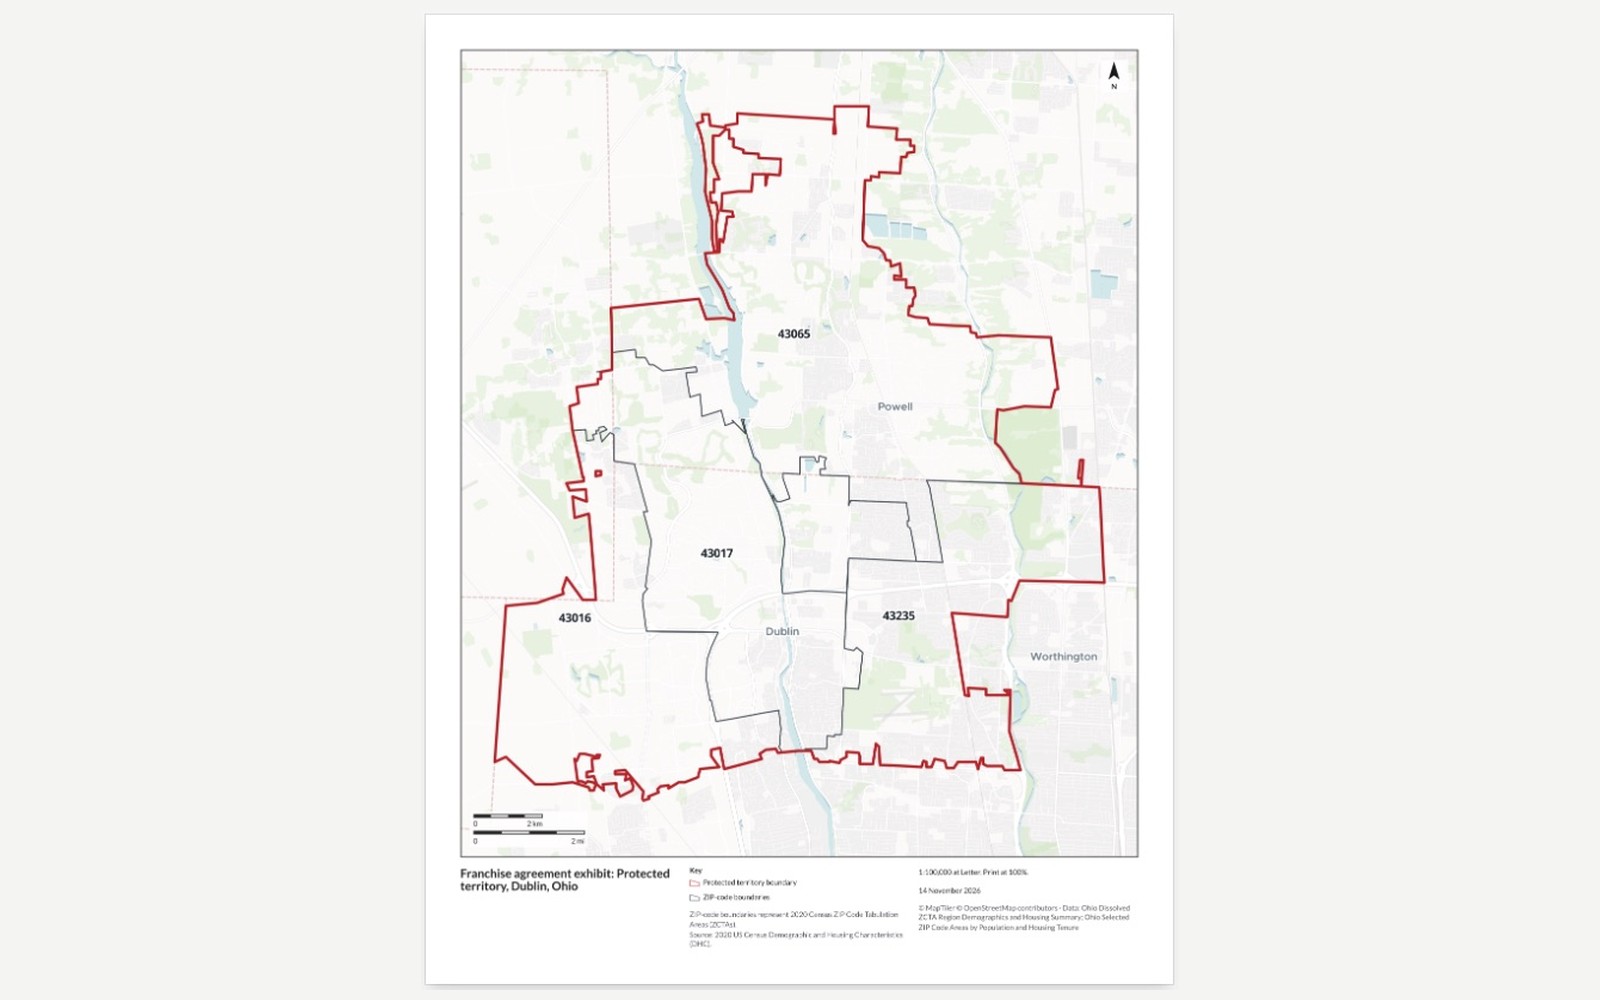
Make this a one-page exhibit for the franchise agreement.
- Or ask
Three examples
Three of many, from different corners of retail. Each shows the request, what came back and who decides.
Every branch, side by side with its neighbors
A regional bank, reviewing its branches around Pittsburgh
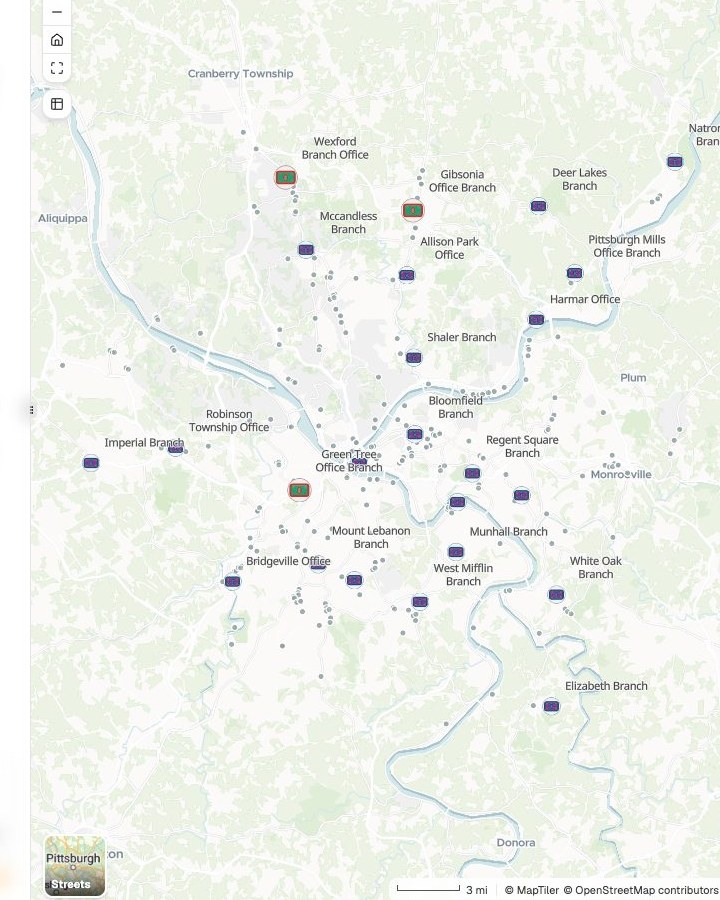
Branches
Deposits, people and other banks within a 10-minute drive
- Our branch
- Weakest on those measures · 3
- Another bank’s branch
The request
Attached are our branches with deposits, and every other bank’s branch. For each of ours, show the people and other banks within a 10-minute drive, and the drive to our next-nearest.
What came back
- Every branch on one map, with other banks’ branches around it
- Deposits, people, rivals and the next-nearest branch, in one table
- A short briefing, with the method and the date of the data
Goes toDistribution strategy, then the board.
Mapstack sets the branches side by side, while the bank decides which stay.
Which chain leads, area by area
The strategy team at a coffee chain, reviewing its rivals across London
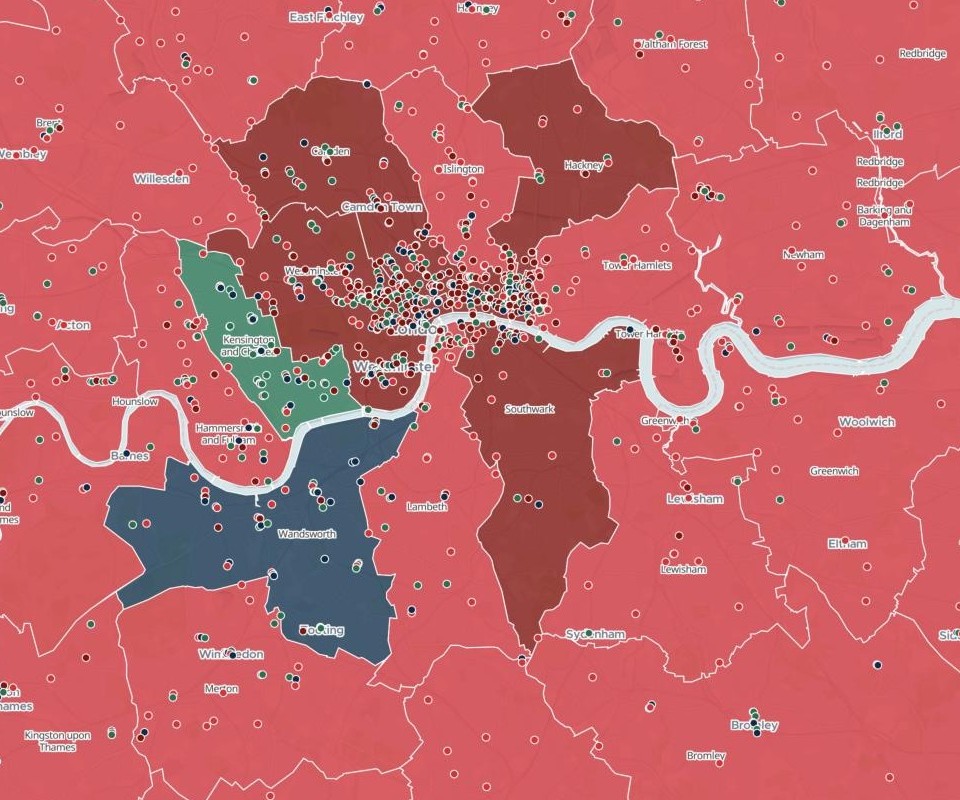
Boroughs
The chain with the most shops
- Chain A leads
- Chain C leads
- Chain B leads
- Chain D leads
The request
Find our shops and our three main competitors’ across Greater London. For each borough, show which brand has the most shops, and how many each has.
What came back
- Each borough colored by the chain that leads it, every shop a dot
- The count of each brand, by borough and in total
- Where the shop locations came from, and their date
Goes toThe competitor review, for leadership.
Mapstack finds and counts the shops, while the strategy team reads the market and leadership sets the plan.
Where the people you want to reach live
The person who does the marketing for a hearing clinic in Tucson, with no GIS training
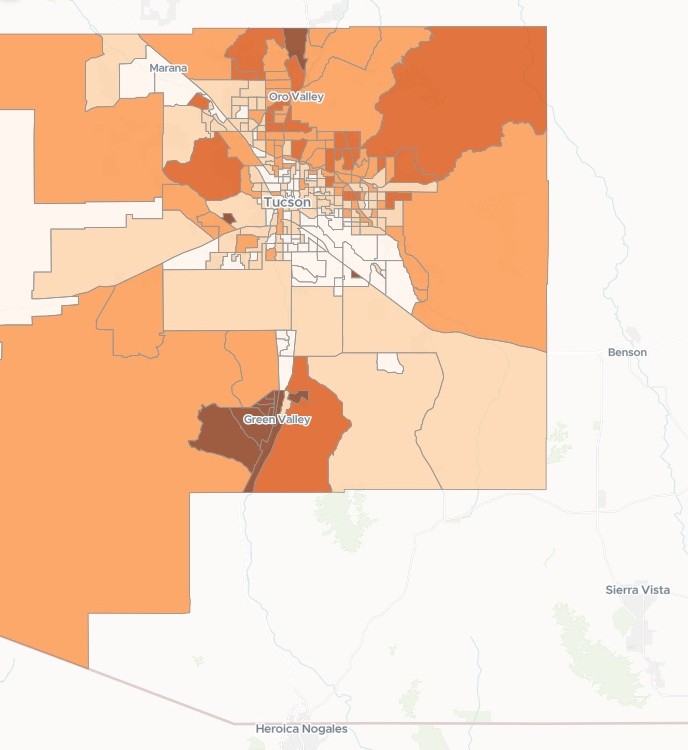
Census tracts
Share aged 65 and over
- 65.6% and above
- 35.6% to 65.6%
- 23.3% to 35.6%
- 13.3% to 23.3%
- Below 13.3%
The request
Show where people aged 65 and over live across our county: how many, and what share of the population, in each area. Use the latest census figures.
What came back
- The county by census tract, shaded by the share aged 65 and over
- A ranked list of ZIP codes, with the count and the share in each
- A note on which census release the figures come from
Goes toThe clinic’s owner, for the mailing plan.
Mapstack shows where they live, while the clinic chooses the neighborhoods and the budget.
An example of how it goes
Four people asked this week. The forecast still got her time.
Maya is the market planning analyst at a franchised restaurant brand. This week franchise development, a real estate manager, a franchisee and finance each have a request in, and the forecasts are hers too.
- territory-zip-codes.xlsx
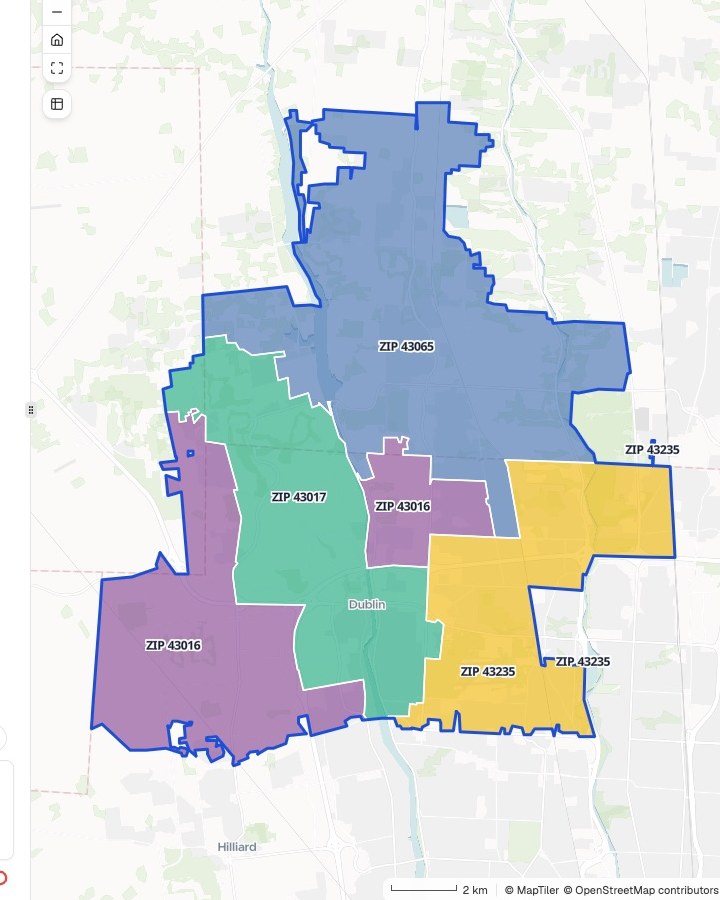
Draw the protected territory made up of ZIP codes 43016, 43017, 43065 and 43235, and count the households in each.
Monday 9:10
Franchise development asks first
A new franchisee near Columbus, and four ZIP codes. Maya hands it to Mapstack and goes back to a forecast.
- Protected territory, by ZIP code
Monday 9:25
The territory is back
Drawn as one area, each ZIP code labeled and counted, with the census release named.
Now make it a one-page exhibit for the franchise agreement, on US Letter.
Monday 9:30
She asks for the exhibit
The same territory on a sheet to scale, ready to attach to the agreement. Nothing is set up again.
- Back with the people who asked
Four requests, four askers
Each checked by Maya and handed to whoever owns the call
Thursday 4:00
The other three follow
What surrounds a candidate site, how much two trade areas share, and the leases ending next year on one map. Each asked in a sentence.
Maya spent the week on the forecasts.
She checked each result and passed it on. The people who asked got their answers while the questions were still live, and her own time went on the forecast and the impact estimate, which are the parts the committee relies on her for.
Works with the data and the model you already have
Your forecast model stays yours, and so does the data you license. Mapstack does the work around them.
- What you bringAs it comes out of your systems, tidy or not.
- Units and sales historyLoyalty and customer dataYour trade areas and forecastsFoot-traffic and property data you licenseFranchise territories
- What Mapstack finds for youPublished data, fetched when you ask and named on the result.
- Census demographicsCompetitors and other businessesDrive timesBoundaries and ZIP codes
- What you hand onIn the form each audience expects.
- Maps and tables for the site packageA territory exhibitA briefing for the boardA shared map people can open and askData for your desktop GIS
Built to be challenged
Whoever signs off will ask where every number came from. The work is made to answer them.

- It does not forecast sales or pick the site. Mapstack measures an overlap and the people in it. Turning that into sales transfer is your model and your judgment, and it does not replace the site visit.
- It does not supply foot-traffic, card-spend or listing data. Bring what you license, as files. Mapstack finds published data and names it on every result.
- The method is written out. How each trade area and each count was worked out comes back with the result, with every assumption stated.
- Your definitions, used as given. Your drive time, your competitor set, your trade areas where you already have them.
- It sits beside the systems you have. Your GIS, your forecast model and your site-selection platform stay. Mapstack reads your exports and hands data back.
The parts of Mapstack retail teams use most
One teammate, whoever is asking.
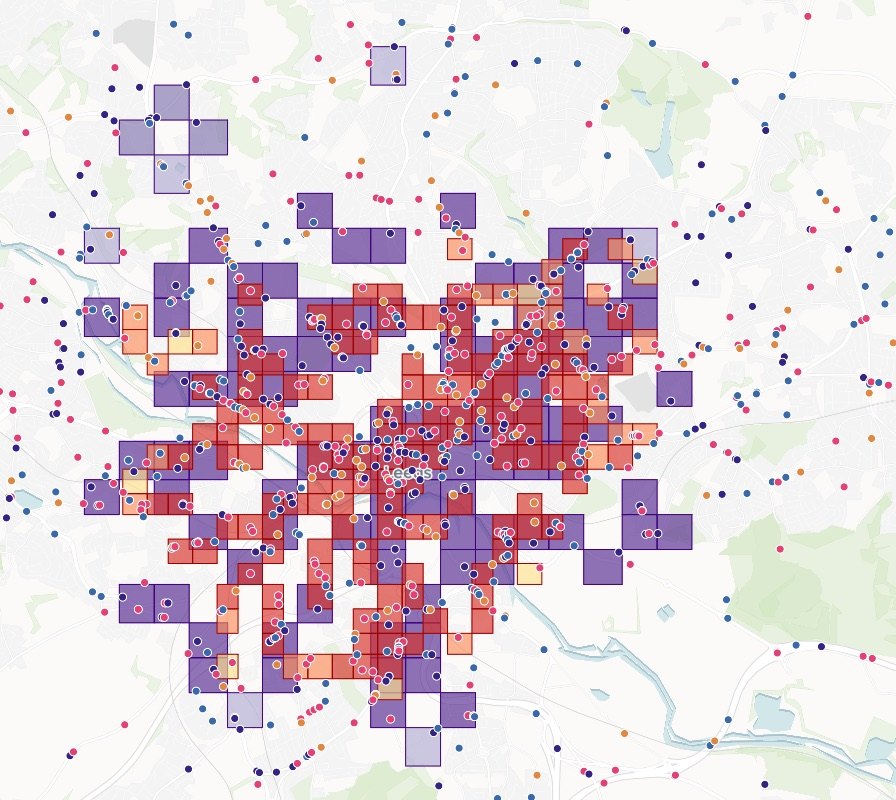
Analysis
Trade areas, overlap and white space.
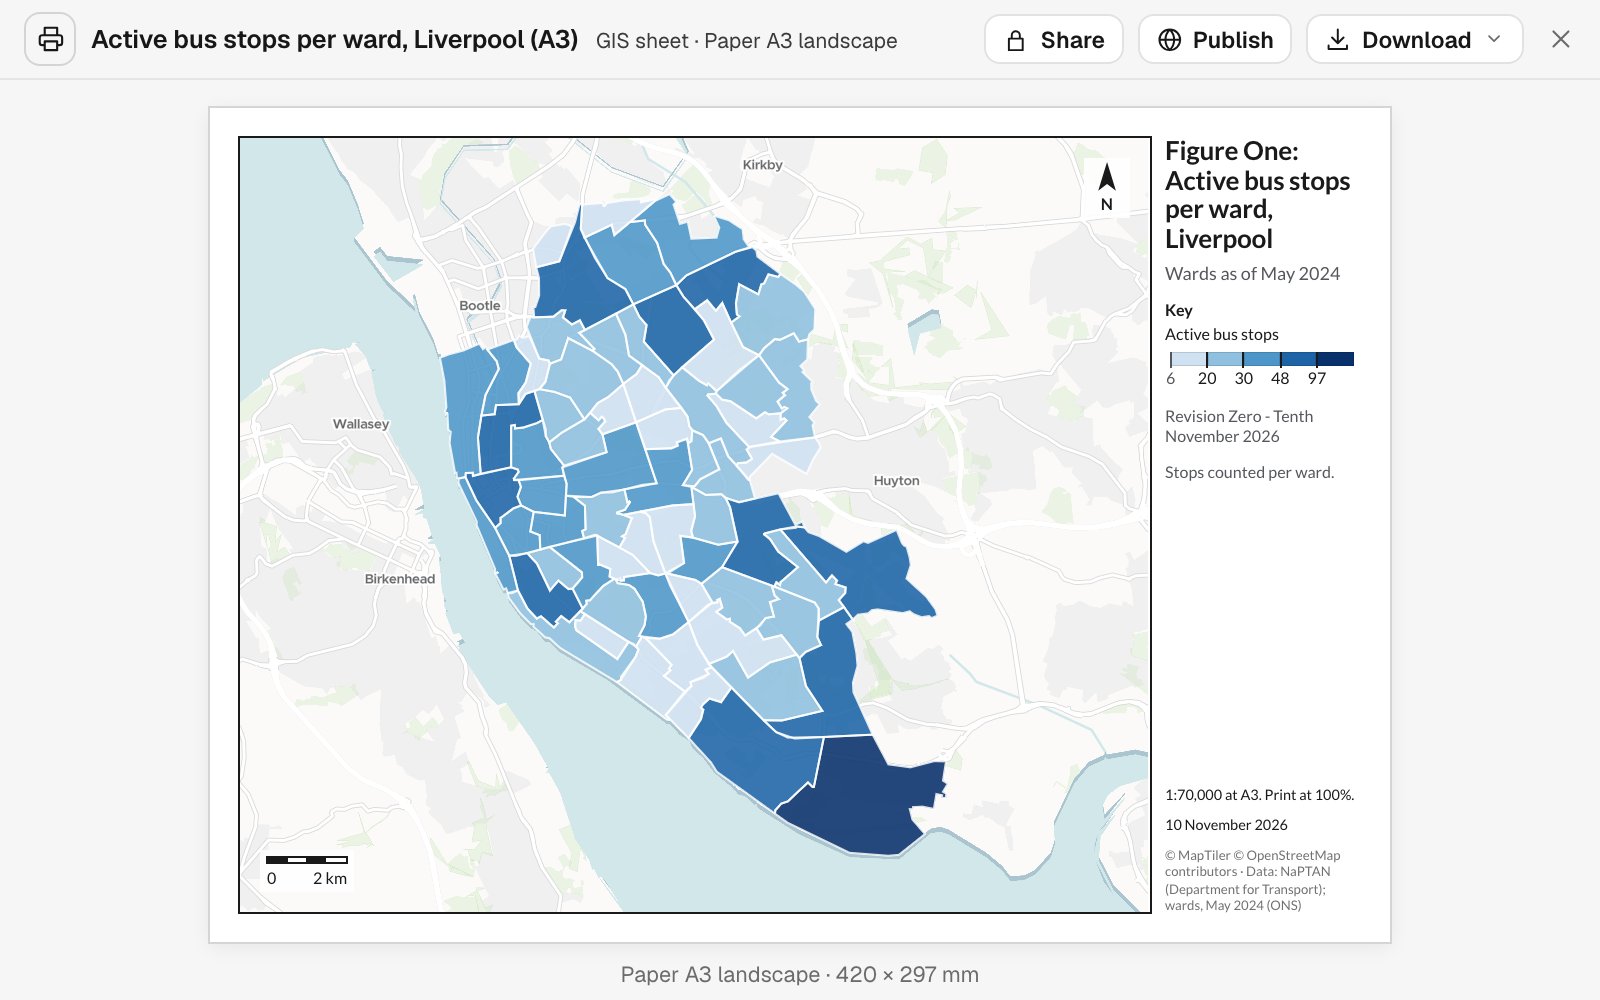
Reports and print maps
Exhibits, briefings and print sheets, to scale.
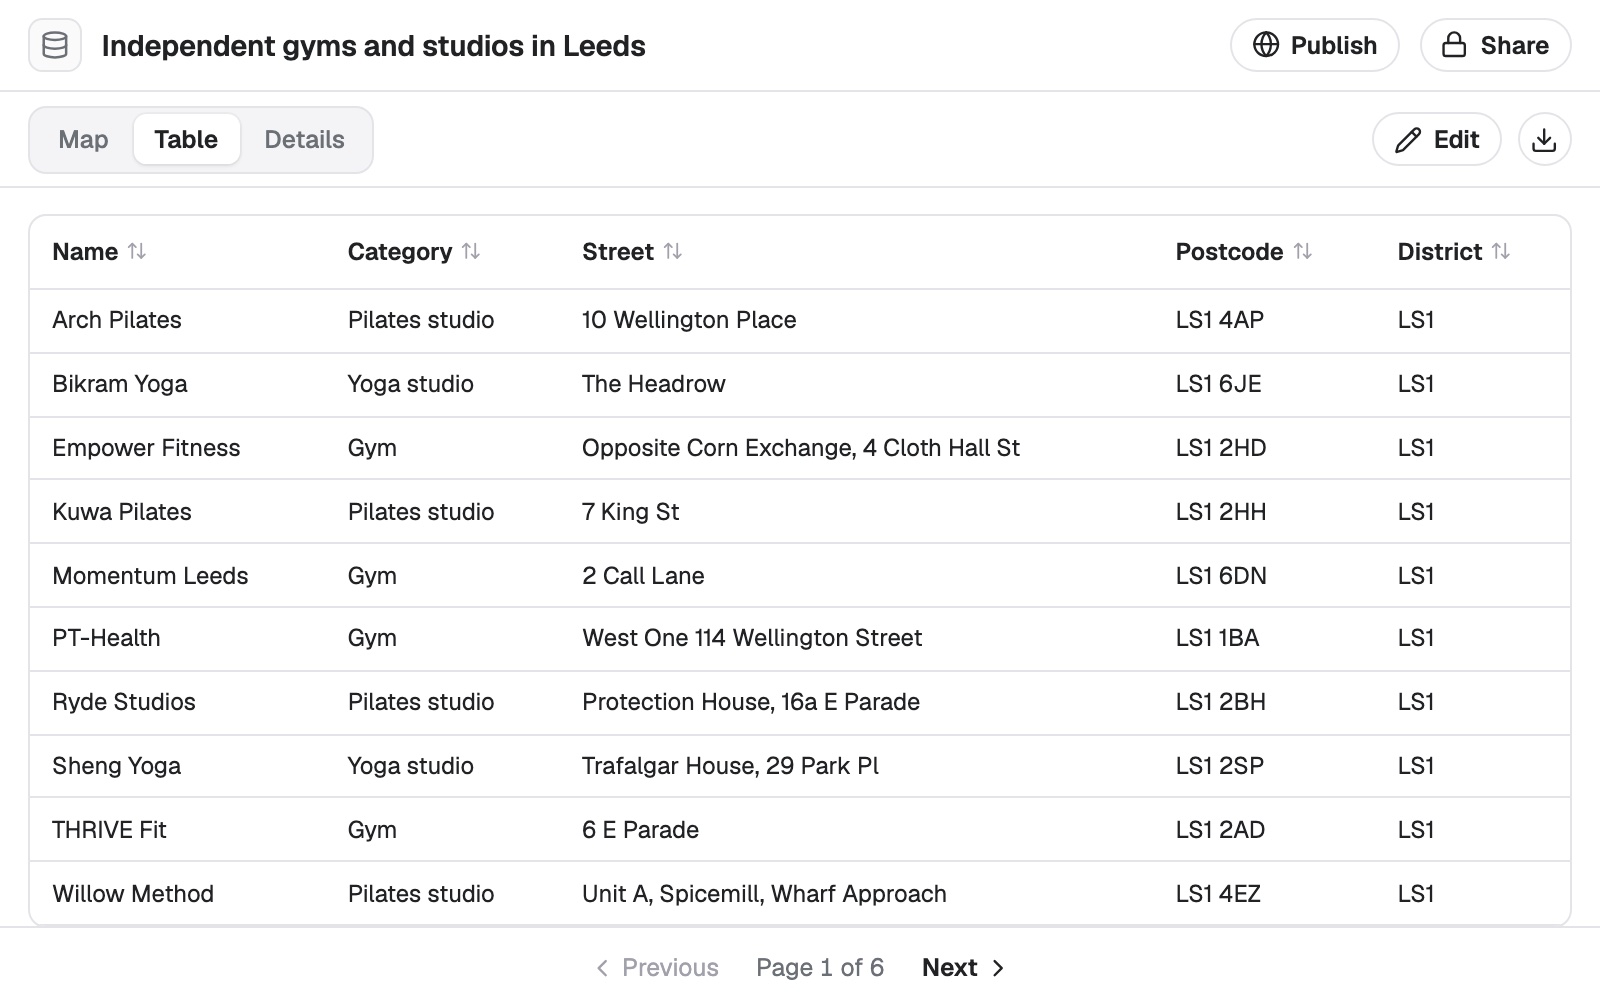
Data
Store and customer lists cleaned, placed and matched.
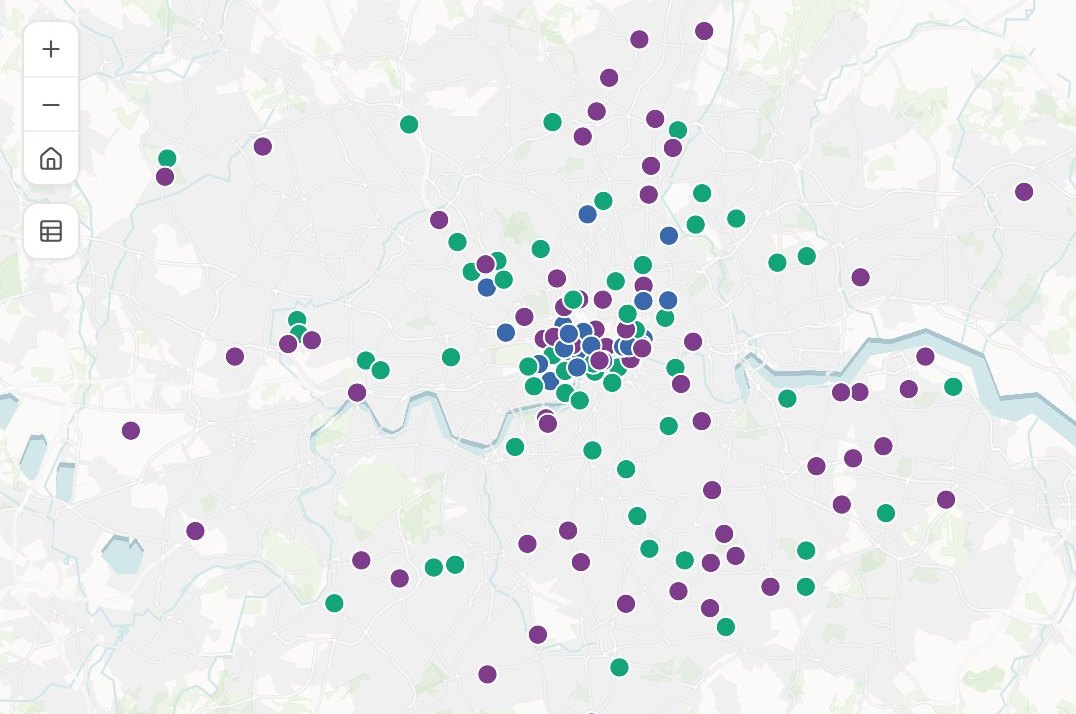
Sharing
Leaders and franchisees open the map and ask.
Looking for a particular job? These go step by step.
- Compare a shortlist of sites before you signYour candidate sites, set side by side on who lives around them.
- See who and what is within reach of a siteHouseholds and competitors in each drive time.
- Find where there is room for more storesThe gap between demand and the stores you have.
- See how much two sites shareThe overlap between two catchments, and what a third would take.
- Find the places most like your best onesEvery district ranked by how alike it is to your best.
- See which brand leads in every areaEvery shop of each brand, counted area by area.
- Decide which branches to closeDeposits, people, rivals and the next branch, side by side.
- Draw a franchise territory and count what it holdsZIP codes as one protected area, its households against your standard.
- Add area facts to every row of a customer listCensus income, age and household size, by address.
- See where your customers cluster, area by areaRecords counted into each neighbourhood, the busiest and quietest named.
- Map your results by area against targetEach area’s rate, the change from last year, and the weak ones picked out.
- Map where the people you want to reach liveHow many in each area, and what share, from the census.
What it costs
Mapstack is priced per person and free to start, with no minimum and no sales call.
Free
$0for one person
Ask about your own files. What comes back stays private to you until you choose to share it.
Creator
$16a person a month, billed yearly
Adds sharing with your team, reports and print sheets, and work that reruns without you.
Creator Max
$80a person a month, billed yearly
The same, with a larger monthly allowance for people who ask all day.
Colleagues who only need the answers take a Viewer seat at $10 a month. They open every result and ask it their own questions. See every plan.
Questions retail teams ask
What location analysis can Mapstack do for a retailer?
Most of what a location analyst is asked for: drive-time and trade areas, demographics around a site, competitor maps, white space, overlap between units, territories, your own lists matched to census figures, and the maps, sheets and reports that carry them. You ask in plain words or in the trade’s terms, and you check the result.
Is it only for analysts, or only for large chains?
No. It is for the analysts who do location work and for the people who wait on them, and it works the same for a group with a handful of units as for a national chain. It is priced per person, with no minimum.
Do we have to replace our GIS or our site-selection platform?
No. Mapstack reads and writes standard GIS and spreadsheet formats and sits beside the systems you have. Your forecast model stays where it is.
Does it work with the foot-traffic and property data we license?
Yes, as files you export. Mapstack does not supply that data. It finds census demographics, competitor locations, drive times and boundaries from published sources, and names them on every result.
How do I build a site package for a real estate committee?
Attach your units and the candidate site and say what the package needs: the trade area, the demographics, the competitors and the overlap with existing units. Mapstack builds the maps and tables and lays them out as a document. You add your forecast and your recommendation.
Can Mapstack run a cannibalization or sales-transfer study?
It does the spatial half: which existing units a new site overlaps, by how much, and how many people or households sit in the overlap. Turning that into sales lost and net-new sales is your forecast model’s job, and the results are laid out so you can add it.
Does Mapstack forecast sales for a new site?
No. It does not replace an analog approach, a gravity model or your own judgment on the ground. It prepares the inputs, the maps and the documents around them.
Can it find white space in a market?
Yes. Give it your units and your competitors’, and say how many people one unit can support. It sets them against population by small area and shows where people are and you are not, with the assumption stated.
Can it draw franchise territories?
Yes. Name the ZIP codes, or say what a territory must hold, and you get the territory on a map, the households in each part, and a one-page exhibit for the agreement. You decide what each franchisee is granted.
Can it help with a branch network review?
Yes. Give it your branches with their deposits and it sets each one beside the people around it, the other banks nearby and the drive to your next-nearest branch. The bank decides which stay.
Does it work for location planning in the UK?
Yes. It draws catchments by drive time, counts residents from the census and works in postcode districts and local authority areas. The London pictures on this page were made that way.
Is the data I upload private?
Yes, on every plan, Free included. Your files and everything made from them are private to your workspace by default. Nothing is public unless you choose to publish it, and you can make it private again.
What happens to my data?
It stays in your workspace and it stays yours. Only the people you give a seat to can see it. It is stored in the United States, it is not used to train AI, and when you delete it, it is removed.
Start with the location question on your desk.
Free to start. No card.