
A real estate portfolio map
See every building you hold on one map.
Attach your property register and your lease schedule. You get every building on one map, owned and leased told apart, with each lease coloured by when it ends.
Free to start. Reports and prints on a paid seat.
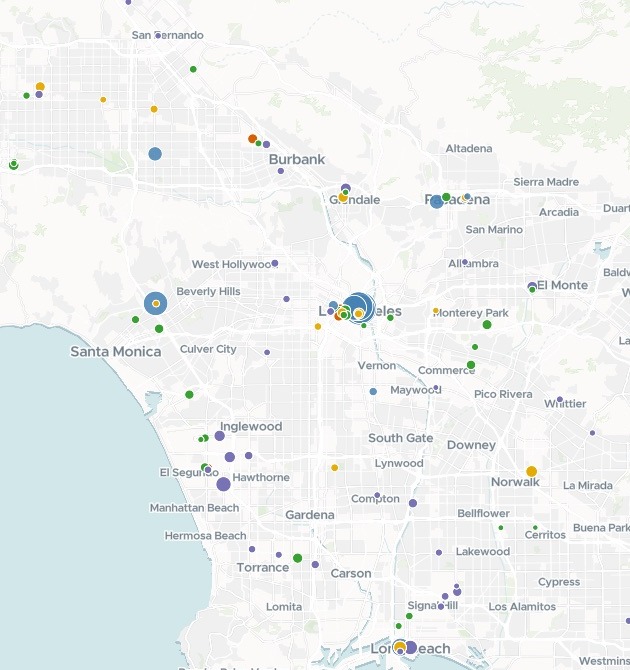
| Each building, sized by space | |
|---|---|
| Lease already past its date | |
| Lease ends by 2027 | |
| Ends 2028 to 2030 | |
| Ends 2031 or later | |
| Owned |
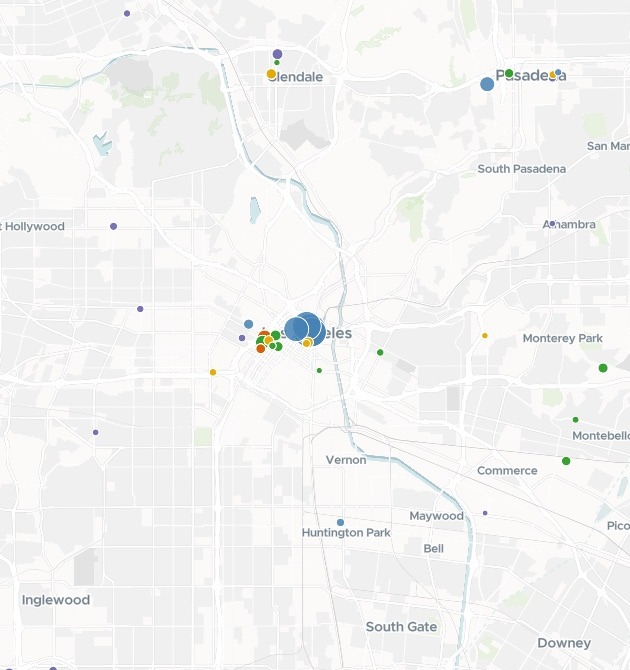
Every building in the state on one map. Shown here: Los Angeles, downtown to Long Beach.
For whoever runs the property book
Hundreds of buildings, owned and leased, in a register and a lease schedule.
The leases keep running out, and someone has to see which ones come next.
Real estate teams call the leases coming due the renewal pipeline. Set against everything held, it is the portfolio: where the space is, how much stands empty and when each lease ends.
Here you attach the two files. Mapstack puts the lease dates on the buildings itself and draws them in the bands you plan by.
One real portfolio
The federal government's California book, and what comes due
The General Services Administration's Inventory of Owned and Leased Properties for California, as two files: a register of 1,247 buildings, 1,165 of them marked leased, and a lease schedule of 652 leases with their dates. Mapstack used the two files and nothing else.
- Due by end of 2027
- 154leases, holding 3,235,571 square feet between them
- Already past
- 72of the 154 are already beyond their expiration date
- Owned space empty
- 9.6%vacant, against 4.0% of leased space
| Largest due in this area | Square feet | Expires |
|---|---|---|
| 915 Wilshire Blvd, Los Angeles | 129,080 | May 2026 |
| One World Trade Ctr, Long Beach | 88,790 | Mar 2027 |
| Imperial Norwalk Centre, Norwalk | 71,588 | Aug 2027 |
| FPD Building, Los Angeles | 54,827 | Dec 2026 |
| 811 Wilshire Blvd, Los Angeles | 54,051 | Apr 2027 |
Past due and coming due, told apart.
Orange bars are leases already beyond their expiration date; amber ones run out by the end of 2027, in the colours of the map. These five are the largest due in the part of Los Angeles mapped at the top. Mapstack ranked the ten largest across the state, each with its lease number, address and date.
US General Services Administration, Inventory of Owned and Leased Properties, buildings and leases in California, from the IOLP data service, 14 November 2026. Run on 14 November 2026.
How it goes
You bring the register and the leases. Mapstack places the buildings and does the sums.
Attach both files and name the bands you plan by.
Mapstack maps every building and colours each lease.
You get the totals by status, in square feet.
Then plan the renewals
Mapstack offered these next.
Share the map
With the people who work the leases.
- Publish the map so the team can open it from a link.
A report
For the regional team.
- Write an executive report on the leases that expire by the end of 2027.
Prints
For the planning meeting.
- Create presentation prints of the expiring leases.
Common questions
What happens to our property data?
It stays in your workspace. Only people with a seat in your workspace can see it. Nothing leaves unless you publish it yourself.
It is not used to train AI. Your data and your conversations are not used to train AI models.
It is still yours. You keep ownership of what you bring in. Delete it and it is removed.
The full answer is in the documentation: Your data, privacy and security.
What does it cost?
Free to start. One seat, for you, with a starter amount of work each month. No card.
The map, the totals and the link are on the free seat. With your own files and public sharing.
A written report or a print is on a paid seat. Paid seats are per person, and bring more work each month.
The prices are on the pricing page.
What is on the map?
Every building. Sized by rentable space: owned in one colour, leased by when the lease ends.
Pop-ups. Space, vacancy, address and the lease dates.
A table and a filter. Search by name or location code, and filter by when the lease ends.
Map yours.
Free to start. Reports and prints on a paid seat.