
Groundwater vulnerability mapping
See where groundwater is most easily polluted.
Attach the groundwater vulnerability map and your source protection areas. You get every class mapped across your county, and how much of each supply's inner zone is on extreme ground.
Free to start. Reports and prints on a paid seat.
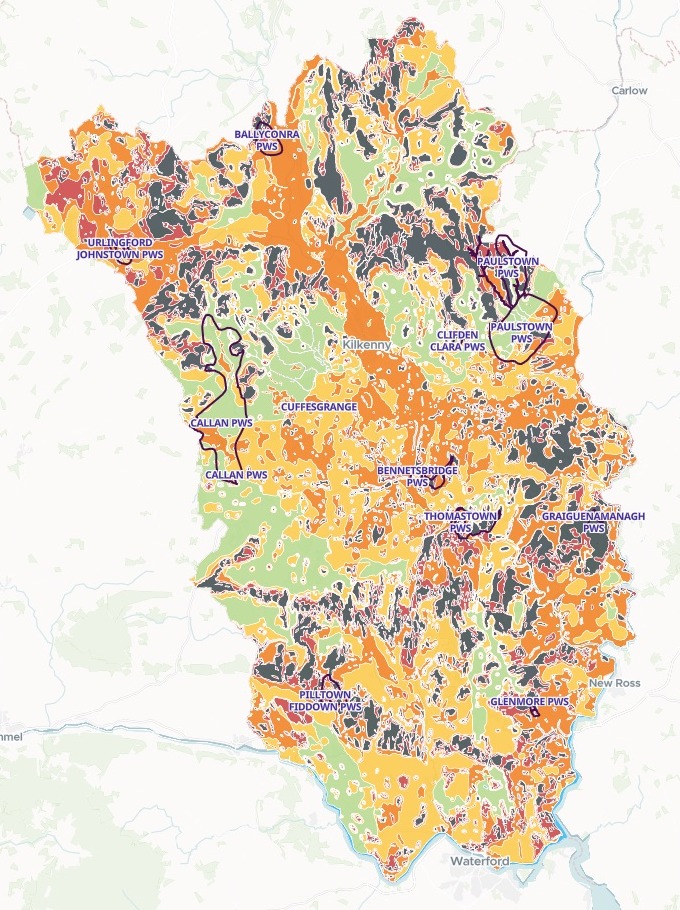
| County Kilkenny, by class | Area | Share |
|---|---|---|
| X: rock at the surface, or karst | 395.1 km² | 19.07% |
| E: extreme | 271.8 km² | 13.12% |
| H: high | 594.8 km² | 28.71% |
| M: moderate | 496.0 km² | 23.94% |
| L: low | 304.1 km² | 14.68% |
| Source protection areas, outlined | 11 supplies |
Almost a third of the county, 666.9 km², is in the two extreme classes.
For whoever decides what is built over groundwater
Planners screening septic tanks.Water services guarding a supply.
The question is where pollution reaches the groundwater, and under which supplies.
Groundwater vulnerability is how easily pollution soaks down from the surface. It is extreme where rock is at or near the surface, or where karst, limestone worn into cracks and channels, lets water run straight in. Each public supply has source protection areas around it: an inner one, within about 100 days of travel to the source, and an outer one for the rest of the ground that feeds it.
Here you attach both and say what to measure. Mapstack does the clipping, the overlay and the arithmetic, and draws the map.
One real county
Which supplies sit on the most exposed ground
County Kilkenny, Ireland: Geological Survey Ireland's vulnerability map and the source protection areas of the county's public water supplies, attached in one message.
- Worst
- 100%of Graiguenamanagh's inner protection area is on X or E ground
- Over half
- 4 of 11supplies have more than half their inner area on X or E ground
- Most extreme ground
- 3.7 km²of X or E ground in Paulstown's inner area, the most of any supply
| Public supply | Inner area on X or E | X or E ground |
|---|---|---|
| Graiguenamanagh | 100.00% | 0.235 km² |
| Pilltown Fiddown | 87.31% | 0.352 km² |
| Cuffesgrange | 57.34% | 0.113 km² |
| Glenmore | 55.24% | 0.128 km² |
| Ballyconra | 48.60% | 1.995 km² |
| Thomastown | 39.38% | 0.394 km² |
| Paulstown | 17.46% | 3.681 km² |
It points out what a share hides.
Paulstown is near the bottom by share, but its inner protection area is by far the largest in the county. Mapstack said so without being asked.
Geological Survey Ireland, Groundwater Vulnerability 1:40,000. Geological Survey Ireland and the Environmental Protection Agency, Public Supply Source Protection Areas, 2026 edition. Both Creative Commons Attribution 4.0, downloaded and attached on 15 November 2026, and run the same day.
How it goes
Attach both files and say what to measure.
Mapstack fetches the county boundary, clips to it and draws the map.
You get the figures beside it.
Go further
The same map, taken on to the next question.
The outer zones
Measure the wider protection areas the same way.
- Do the same for the outer source protection areas: how much of each is X or E, ranked worst first.
Planning applications
Check new sites against the map.
- Here are this month's planning applications for one-off houses with septic tanks. Tell me which vulnerability class each site is in, and whether it is inside a source protection area.
For the plan review
Put it in front of the people who decide.
- Lay the map out as a print-ready A3 sheet for the development plan.
- Write the findings up as a short report for the plan review.
Common questions
What happens to our files?
It stays in your workspace. Only people with a seat in your workspace can see it. Nothing leaves unless you publish it yourself.
It is not used to train AI. Your data and your conversations are not used to train AI models.
It is still yours. You keep ownership of what you bring in. Delete it and it is removed.
The full answer is in the documentation: Your data, privacy and security.
What does it cost?
Free to start. One seat, for you, with a starter amount of work each month. No card.
The map, the areas and the ranking are on the free seat. With your own files and public sharing.
A print-ready sheet or a written report is on a paid seat. Paid seats are per person, and bring more work each month.
The prices are on the pricing page.
What do I need to bring?
The files as you downloaded them. Zipped shapefiles went in as they came from the survey, classes and supply names unchanged.
A box around your area is enough. Mapstack fetches the county boundary and clips to it.
Nothing to recode. The classes keep their letters, X to L, and every supply is named as it is in your file.
Map yours.
Free to start. Reports and prints on a paid seat.