
Conservation priorities
Find which land to protect next.
Attach your species records, protected areas and boundary. You get the threatened species counted in each grid square, and the unprotected squares ranked.
Free to start. Written reports on a paid seat.
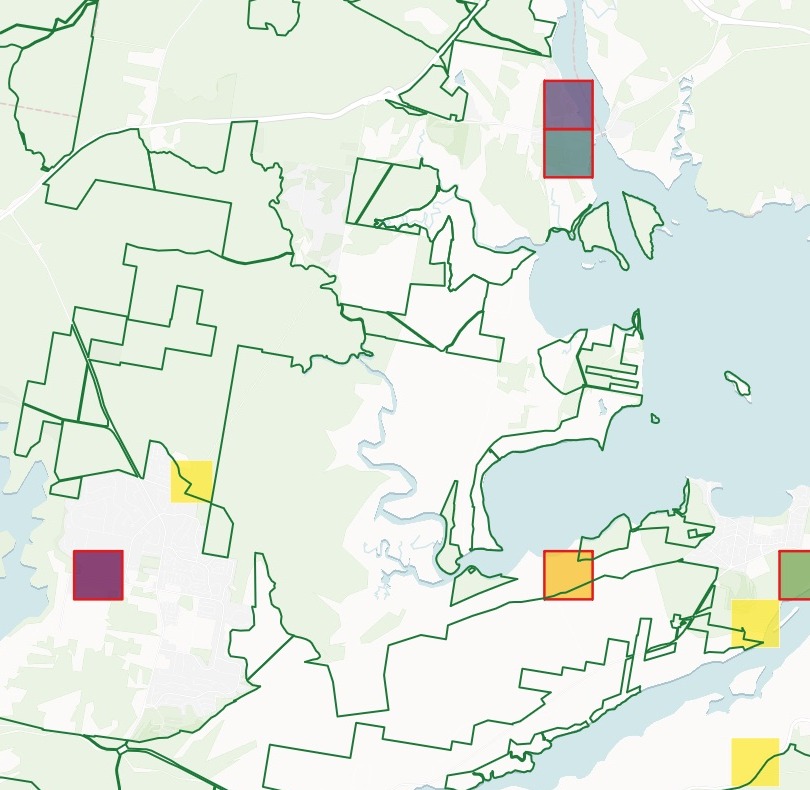
| Threatened species in a 1 km square | |
|---|---|
| Protected areas | 22.71% of the area |
| Top 20, under half protected | 7+ species |
| 19 and above | |
| 12 to 19 | |
| 9 to 12 | |
| 8 to 9 | |
| Fewer than 8 | Yellow, orange |
Most of the richest squares sit outside the reserves.
One real council
How well the reserves cover the threatened species
Port Stephens, New South Wales: ten years of NSW BioNet records of threatened species, the national CAPAD 2024 protected areas and the council boundary, in one message.
- Hotspots covered
- 5 of 45squares with 6 or more threatened species are at least half inside a reserve
- Under a quarter
- 65 of 92threatened species have less than a quarter of their records inside a reserve
- None inside
- 45of those species have no record inside any reserve
| Under a quarter protected, most recorded | Records | Inside a reserve |
|---|---|---|
| Koala | 5,605 | 5.8% |
| Camfield's Stringybark | 2,270 | 7.4% |
| Grey-headed Flying-fox | 996 | 2.1% |
| Wallum Froglet | 136 | 19.1% |
| Little Bentwing-bat | 114 | 7.9% |
| Tall Knotweed | 104 | 0.0% |
It answers species by species.
The Koala, by far the most recorded, is on the list. Every species on it comes with its scientific name, its records and how many of them fall inside a reserve.
NSW BioNet Atlas (NSW Department of Climate Change, Energy, the Environment and Water), records of species threatened in NSW, 2015 to 2024, through the Atlas of Living Australia, with blurred locations left out. Collaborative Australian Protected Areas Database (CAPAD) 2024. Australian Bureau of Statistics, local government areas, 2023. Downloaded and attached on 15 November 2026, and run the same day.
For whoever decides which land to protect
Council ecologists.Land trusts.Park agencies.The records say where the rare species are.
The question is how much of that the reserves already hold, and where to go next.
Counting the different species in each square, not the records, gives species richness; the richest squares are biodiversity hotspots. Laying the protected areas over them shows what is missing. Conservation planners call this a gap analysis.
Here you bring the records and the reserves. Mapstack builds the grid, does the counting and the overlay, and hands you the list to act on: conservation zoning, stewardship agreements or purchase.
The list to act on
The squares to go after first
Every square less than half protected, ranked by its number of threatened species, ties broken by records. Each comes with its ID, its share protected and its species by common name.
- First
- Z-17Swift Parrot, Brush-tailed Phascogale, Squirrel Glider and Koala among its species, and none of it protected
- Most records
- AV-18194 records of 8 species, ninth: species come first, records only break ties
- Most protected
- U-3the most protected of the 20, with 22.7% of the square inside a reserve
| Square | Threatened species | Records |
|---|---|---|
| Z-17 | 19 | 22 |
| AJ-27 | 12 | 41 |
| X-9 | 10 | 21 |
| AJ-26 | 9 | 20 |
| AU-14 | 9 | 19 |
| V-23 | 9 | 14 |
The first seven are 0.0% protected.
AJ-27's species include eight bats, a Koala and a Squirrel Glider. AU-14 has a Green Turtle, a Shy Albatross and a Sooty Tern beside its Koala.
Ranked by Mapstack from the same records and protected areas, 15 November 2026.
How it goes
Attach the records, reserves and boundary in one message.
Mapstack maps the hotspots with the reserves outlined.
Click any square for what is in it.
Common questions
What happens to our species records?
It stays in your workspace. Only people with a seat in your workspace can see it. Nothing leaves unless you publish it yourself.
It is not used to train AI. Your data and your conversations are not used to train AI models.
It is still yours. You keep ownership of what you bring in. Delete it and it is removed.
The full answer is in the documentation: Your data, privacy and security.
What does it cost?
Free to start. One seat, for you, with a starter amount of work each month. No card.
The grid, the counts, the ranking and the map are on the free seat. With your own files and public sharing.
A written briefing report is on a paid seat. Paid seats are per person, and bring more work each month.
The prices are on the pricing page.
What does it count?
Species, not records. Each square gets the number of different threatened species recorded in it, with the number of records beside it.
By your rules. Say how many species make a hotspot, and how much of a square must be protected to count as covered.
On the grid you name. Squares of the size you ask for, each with an ID, kept to your boundary.
Find your priorities.
Free to start. Written reports on a paid seat.