
Precision farming: management zones
Split your farm into management zones.
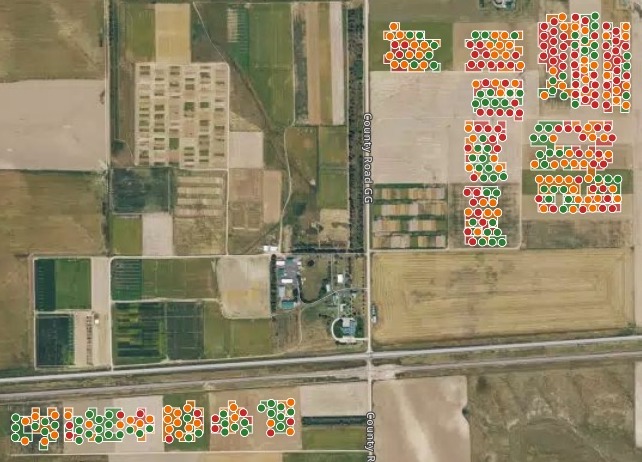
Attach your grid sample points with their soil and yield. You get low, medium and high potential zones on a map, and what sets each apart.
Free to start. No card.
| Management zone | Average yield |
|---|---|
| High potential | 3,454 |
| Medium potential | 2,993 |
| Low potential | 2,206 |
Average yield in each zone, in kg/ha, over four seasons of wheat, corn and proso millet.
For whoever sets next season’s rates
Agronomists.Farm managers.Crop advisers.The soil samples say what the ground is.The yields say what it gave.
The zones need both, point by point.
Management zones split a field into parts that behave alike, so seed and nitrogen go where they will pay. They are the starting point of precision agriculture and variable-rate application.
Here you attach the sample points. Mapstack draws the zones, says what sets each apart and puts them on a map of your fields.
From grid samples to zones
Columns: Latitude, longitude (one pair for each point), Field (the field the point is in), Sand % (from soil sampling), Carbon % (soil carbon, from sampling), Crop, each year (wheat, corn or millet), Yield, each year (blank where none). 321 rows. One row for each sample point, with a crop and a yield column for each year.
What you get
- Yields weighed fairly: each set against the average for its field, crop and year (a z-score), so a millet year and a corn year count alike.
- A zone for every point, from one index of yield, sand and soil carbon, in three equal groups.
- What sets each zone apart: its average sand, soil carbon and yield.
- A map with charts: sand against yield, yield by zone, and filters by field, rotation and zone.
One real farm
Three zones, set apart by sand and soil carbon
A dryland research farm in northeastern Colorado, published by the USDA: grid sample points in 18 fields, soil sampled in 2018, yields from 2019 to 2022 in a wheat, corn and proso millet rotation.
- High zone
- +0.78standard deviations above the average yield for its field, crop and year
- Low zone
- −0.77below it, and short across all four seasons
- What sets them apart
- Sandthe sandier the ground, the lower the zone
| Zone | Sand | Soil carbon |
|---|---|---|
| High potential | 36.67% | 1.03% |
| Medium potential | 44.40% | 0.86% |
| Low potential | 53.34% | 0.69% |
The low zone is the coarse ground.
In Mapstack’s reading, sandy soil with little carbon loses water fast in a dry spell, while finer soil with more carbon holds water and nutrients through it.
USDA Ag Data Commons, “Data from: Topographic position index predicts within-field yield variation in a dryland cereal production system”, set out one row per point with latitude and longitude. Run on 15 November 2026.
A starting point for next season’s seed and nitrogen
Say what the zones are for, and Mapstack suggests what to do in each.
It is a suggestion, zone by zone. The rates are yours to set.
I need 3 management zones I can use for variable-rate seeding and nitrogen next season.
Its suggestion: on the high zone, higher seeding rates and more topdress nitrogen, where the soil holds enough water for a denser stand. On the medium zone, standard seeding and moderate nitrogen. On the low zone, fewer seeds and conservative nitrogen, so inputs are not spent where water runs short.
How it goes
You bring the sample points. Mapstack weighs the yields, draws the zones and makes the map.
Attach your sample points and say what the zones are for.
Mapstack maps the zones over your fields.
You get what sets each zone apart.
Common questions
What happens to our field data?
It stays in your workspace. Only people with a seat in your workspace can see it. Nothing leaves unless you publish it yourself.
It is not used to train AI. Your data and your conversations are not used to train AI models.
It is still yours. You keep ownership of what you bring in. Delete it and it is removed.
The full answer is in the documentation: Your data, privacy and security.
What does it cost?
Free to start. One seat, for you, with a starter amount of work each month. No card.
This job is on the free seat. Maps, datasets, analysis, your own files and public sharing are all included.
Pay per person for more. A paid seat brings more work each month, and seats for your team.
The prices are on the pricing page.
Zone yours.
Free to start. No card.