
Mapstack for engineering and construction
The AI teammate for engineering GIS work.
Ask in plain words. Mapstack makes the constraints plan, the figure or the table.
Free to start. No card.
Where project teams stand today
Every project turns on what is known about its site. Getting that onto a map is the slow part.
More work than people
Firms report more projects than staff to deliver them, and are looking to technology as much as to hiring.
The map work is shared, the deadlines are not
One specialist, or someone with another job to do, serves every project manager. Each project has its own submission date.
Others set the standard, and you sign
A regulator or a client says what the map must show and sends back what does not comply. A named professional signs what goes out.
Know the site before you design or build.
What changes with Mapstack
Today a question about the site waits for the one person who can draw the answer. With Mapstack, the project team asks and has the answer when the project needs it.
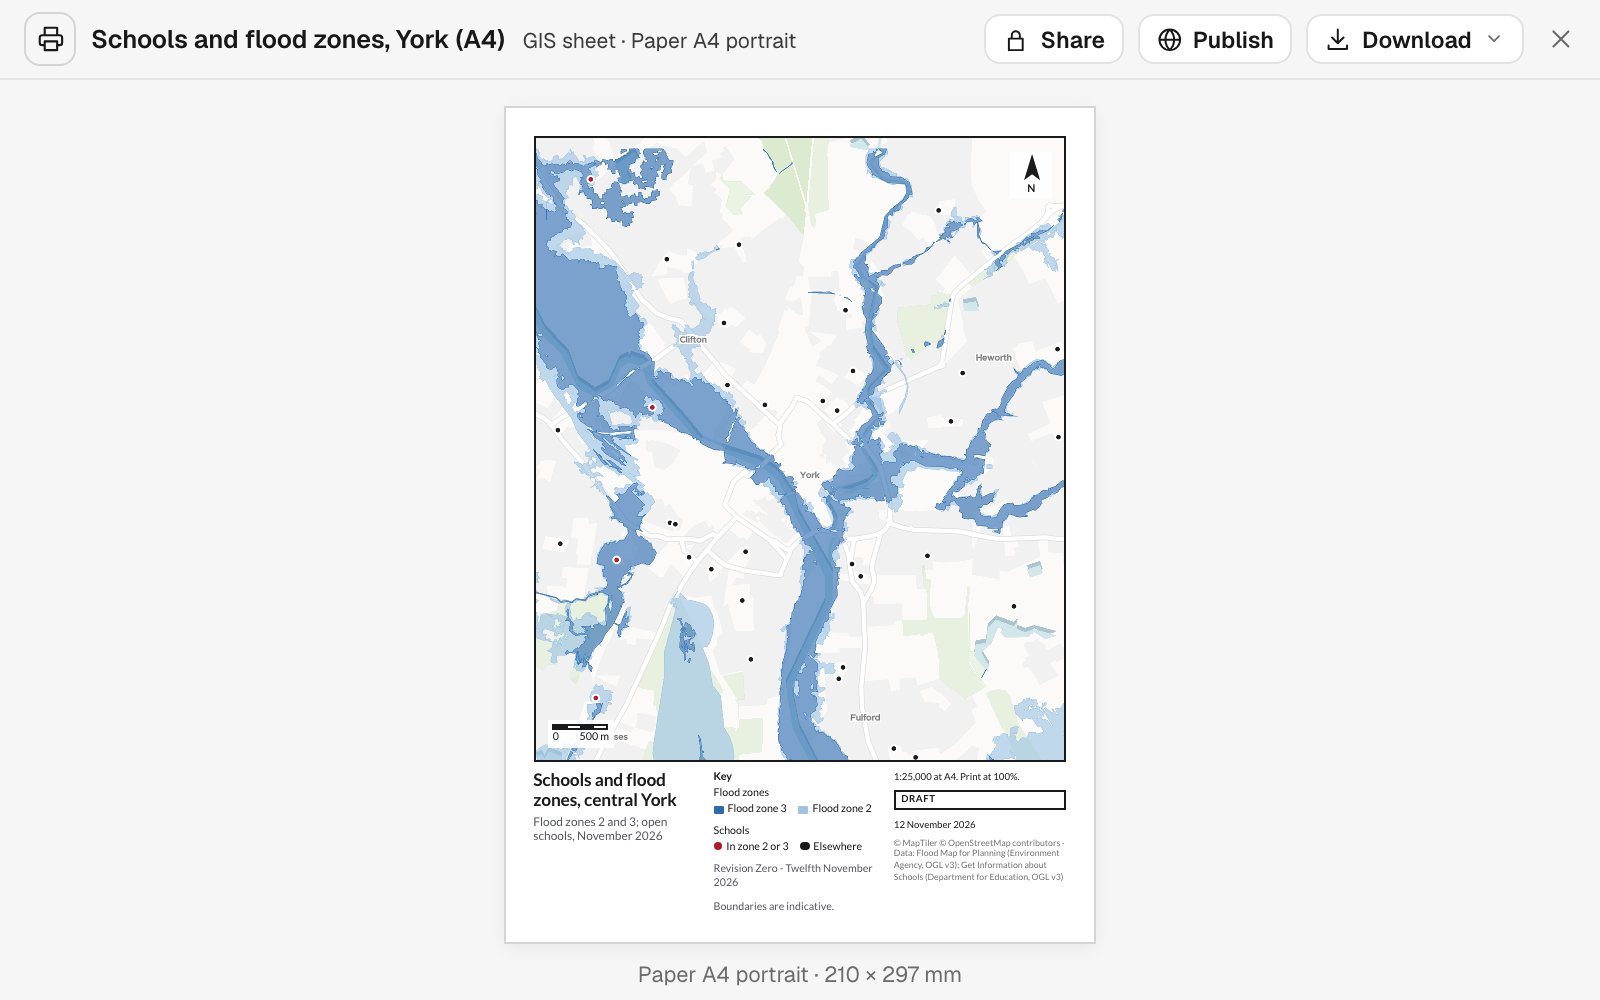
See what a site is up against, early
Lay a site, a route or a whole list of sites over the constraints you name. You get what covers each one and what is near it, as a map and a table.
- Or ask
Which designations cover the site, and how far away are the rest?
Which of the client’s sites are in flood zone 2 or 3?
- Or ask
Take the measurements from the map
Lengths, areas, counts and distances are worked out from the geometry and handed back as a table beside the map.
- Or ask
How much of the site is in flood zone 3, and how much in zone 2?
How many bus stops and proposed crossings are within 25 m of the route?
What lies within 25 m of the route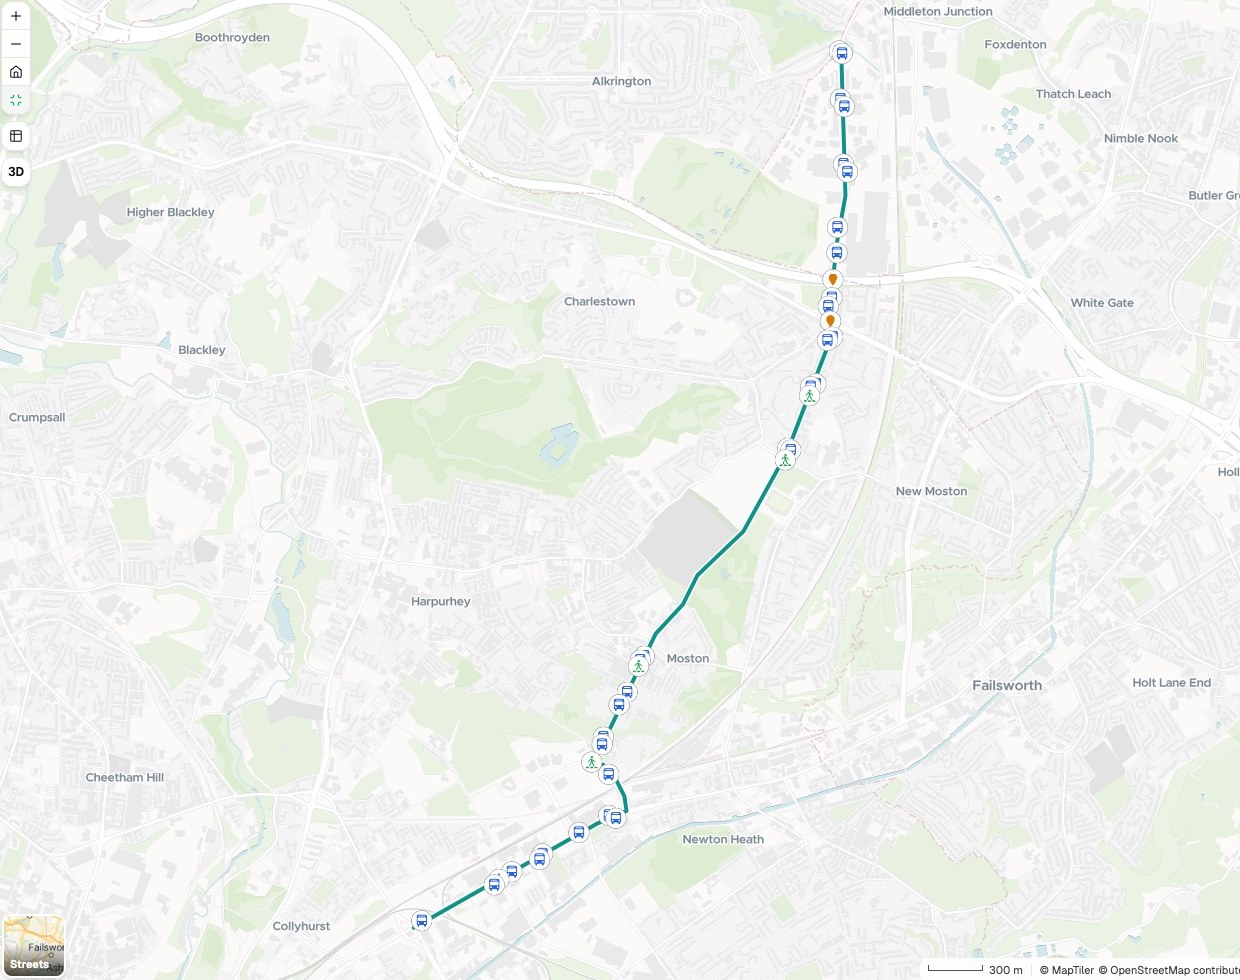
- Or ask
Show the survey to people without the software
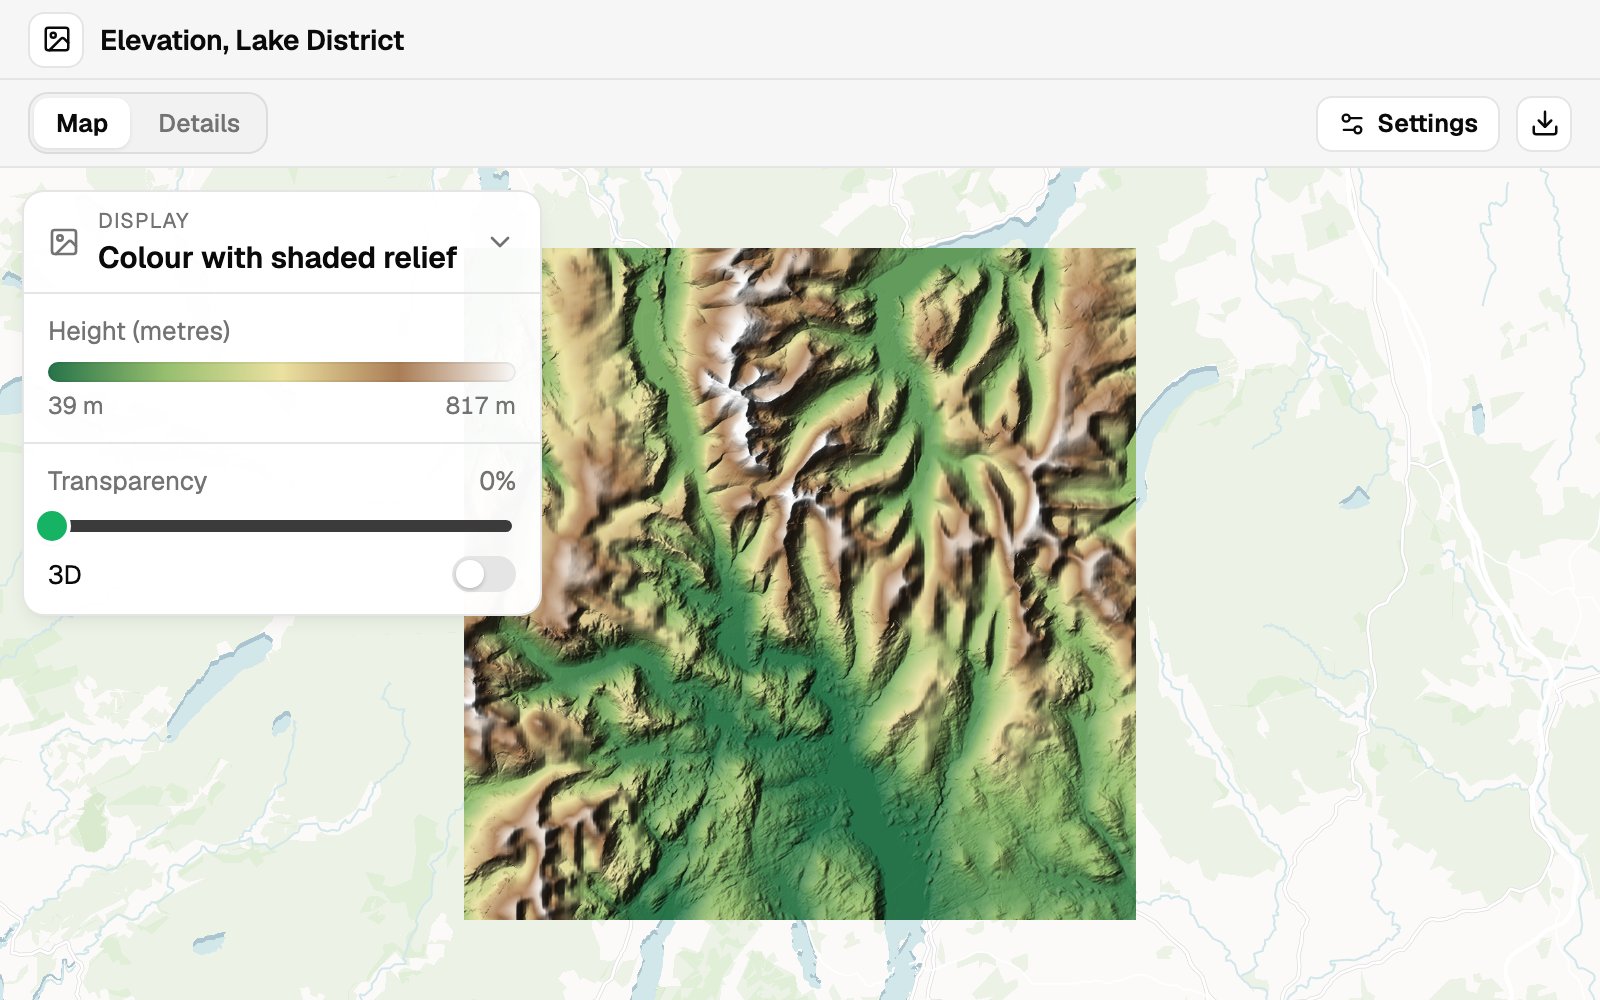
Orthomosaics, elevation models and point clouds go on a map that opens in a browser, shown as relief, slope, height or class.
- Or ask
Put the orthomosaic and the point cloud on one map the client can open.
Show this elevation model as shaded relief, and tell me the lowest and highest heights.
- Or ask
Issue it the way the submission asks
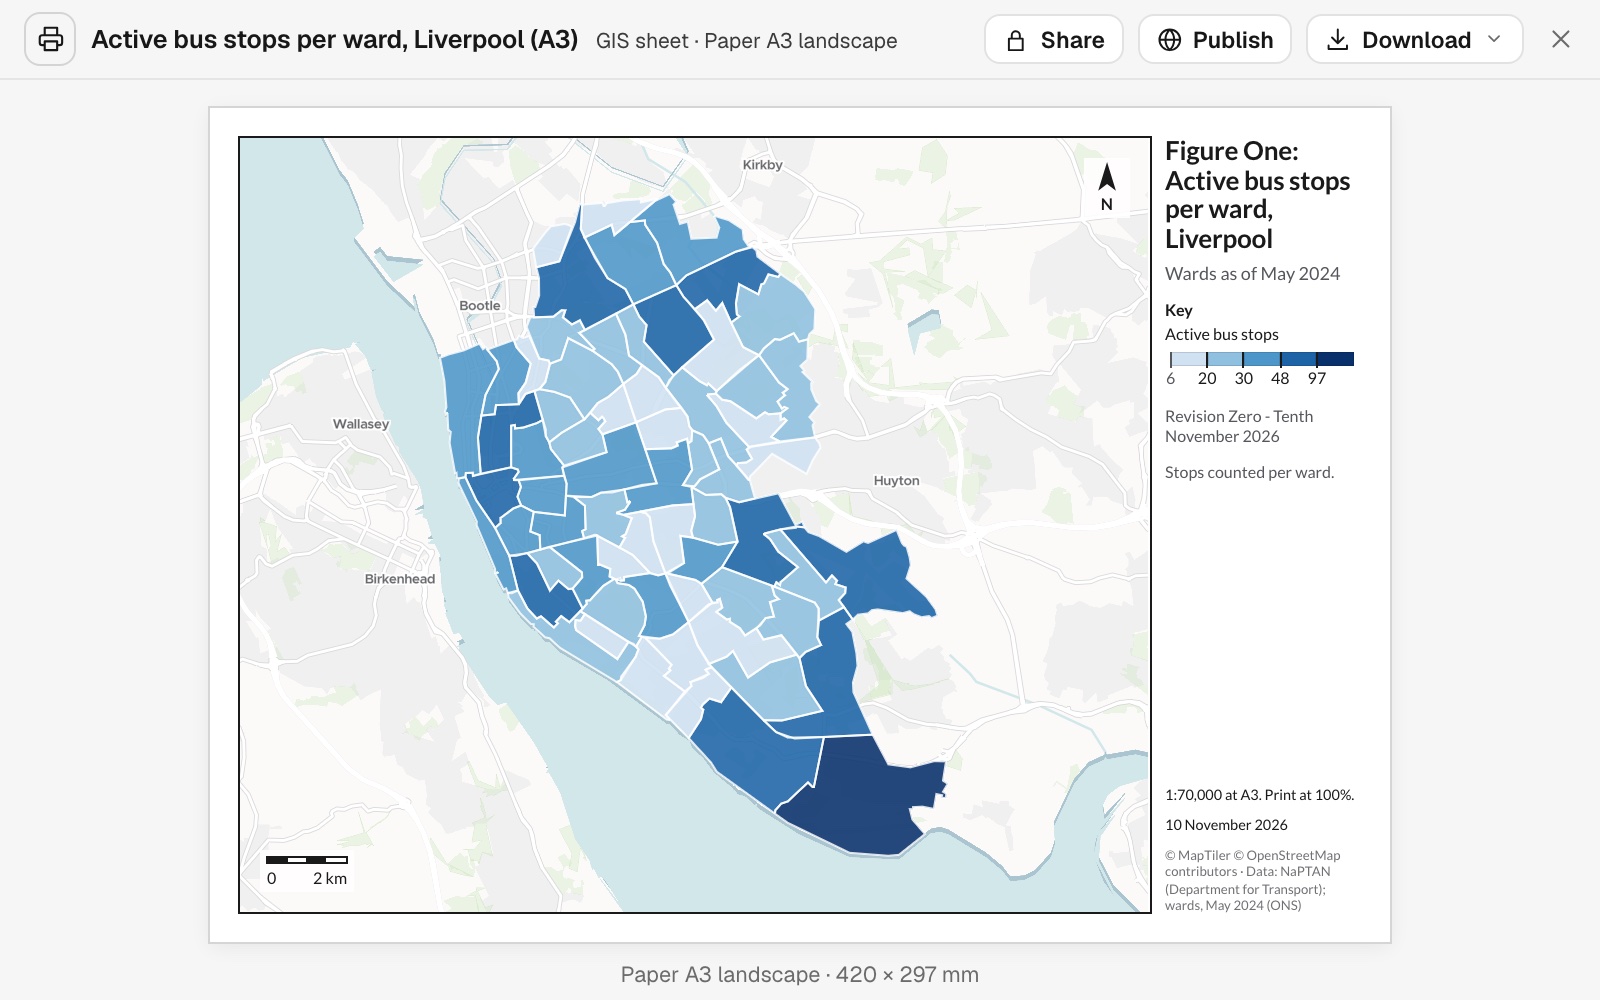
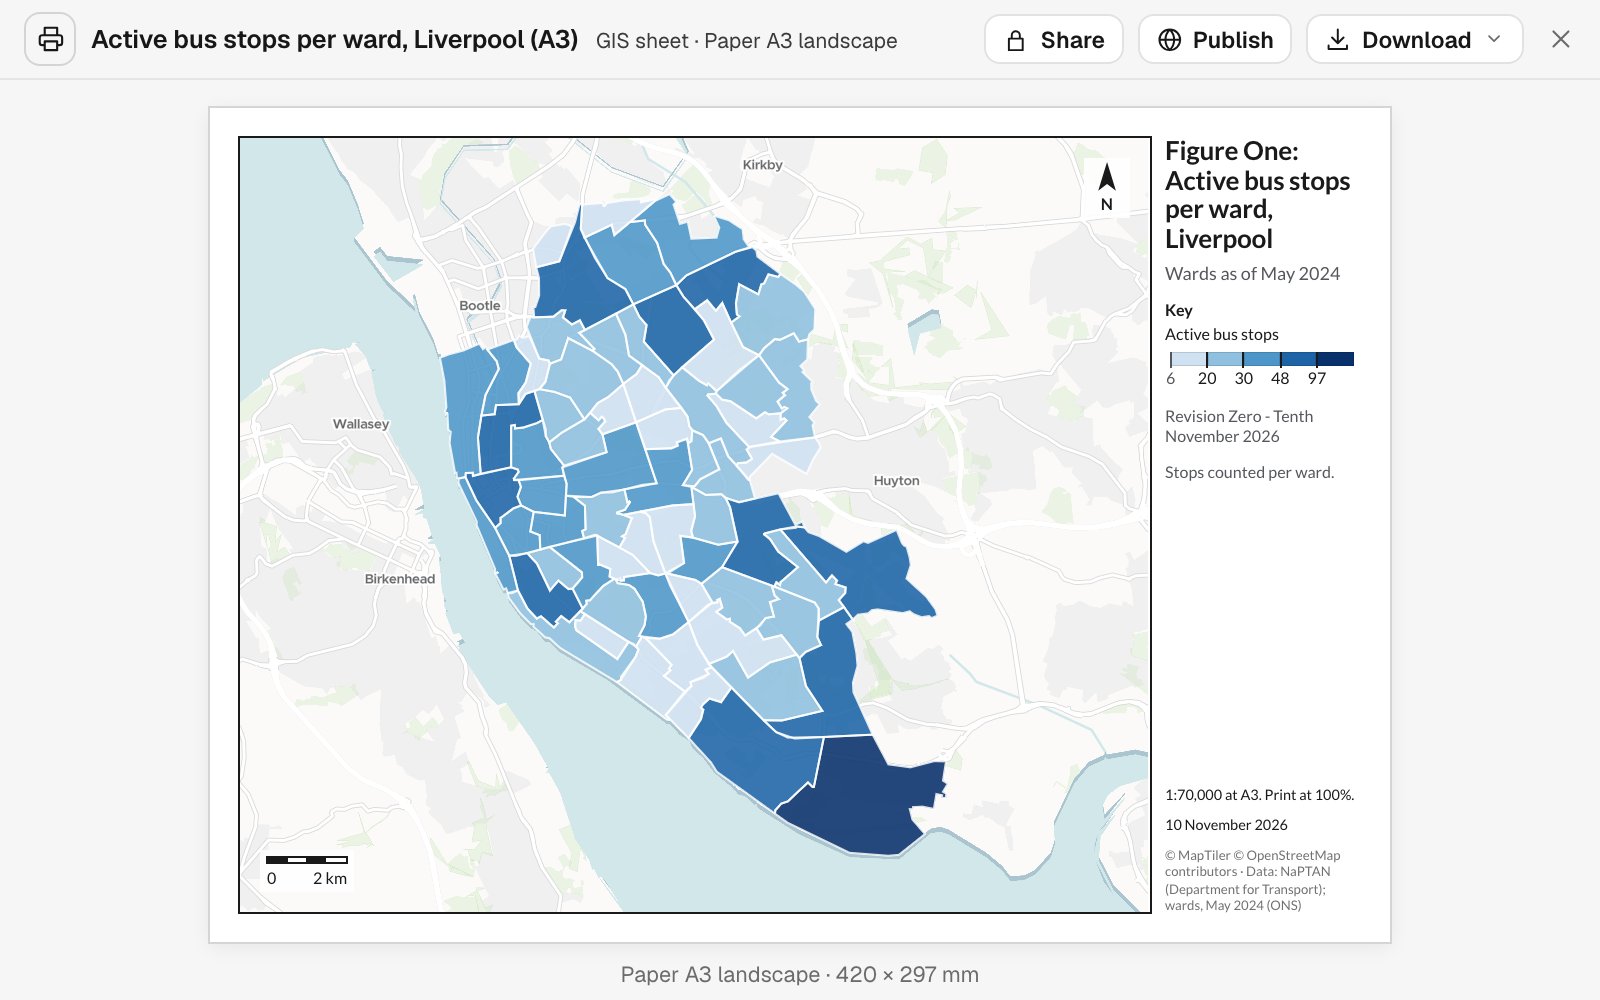
Figures come to scale on the sheet you name, with a title block, figure number, revision and sources. When something changes, ask and the figure is reissued.
- Or ask
Make the project location map for the bid, sized for a slide.
Make this Figure 1, revision 0, on A3 with a scale bar and sources.
- Or ask
Three examples
Three of many, from different corners of the industry. Each shows the request, what came back and who decides.
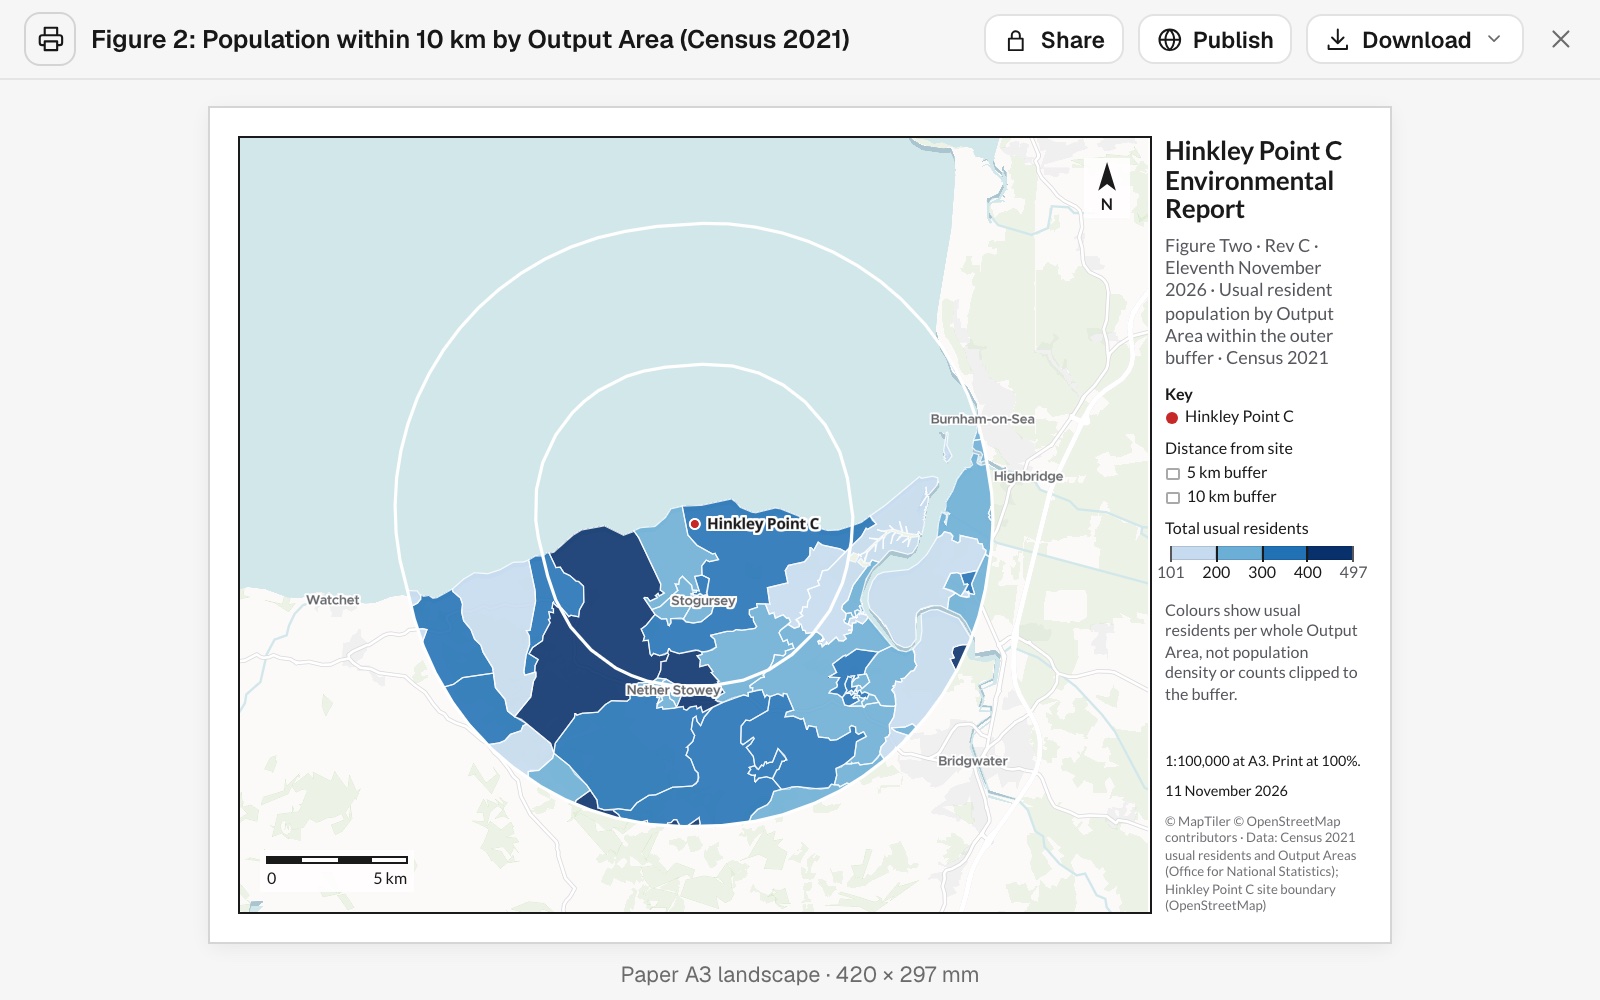
Who lives around the site, as Figure 2
An environmental consultancy, preparing an environmental report
The request
Attached is the site. Show census residents by output area within 5 km and 10 km, as Figure 2 in the same A3 layout as Figure 1.
What came back
- Residents in every output area within 10 km, from the 2021 Census
- An A3 figure at the same scale and layout as Figure 1
- The revision, the date and the sources in the title block
Goes toThe project manager, for the environmental report.
Mapstack draws the figure and counts the residents, while your assessors judge what the numbers mean for the scheme.
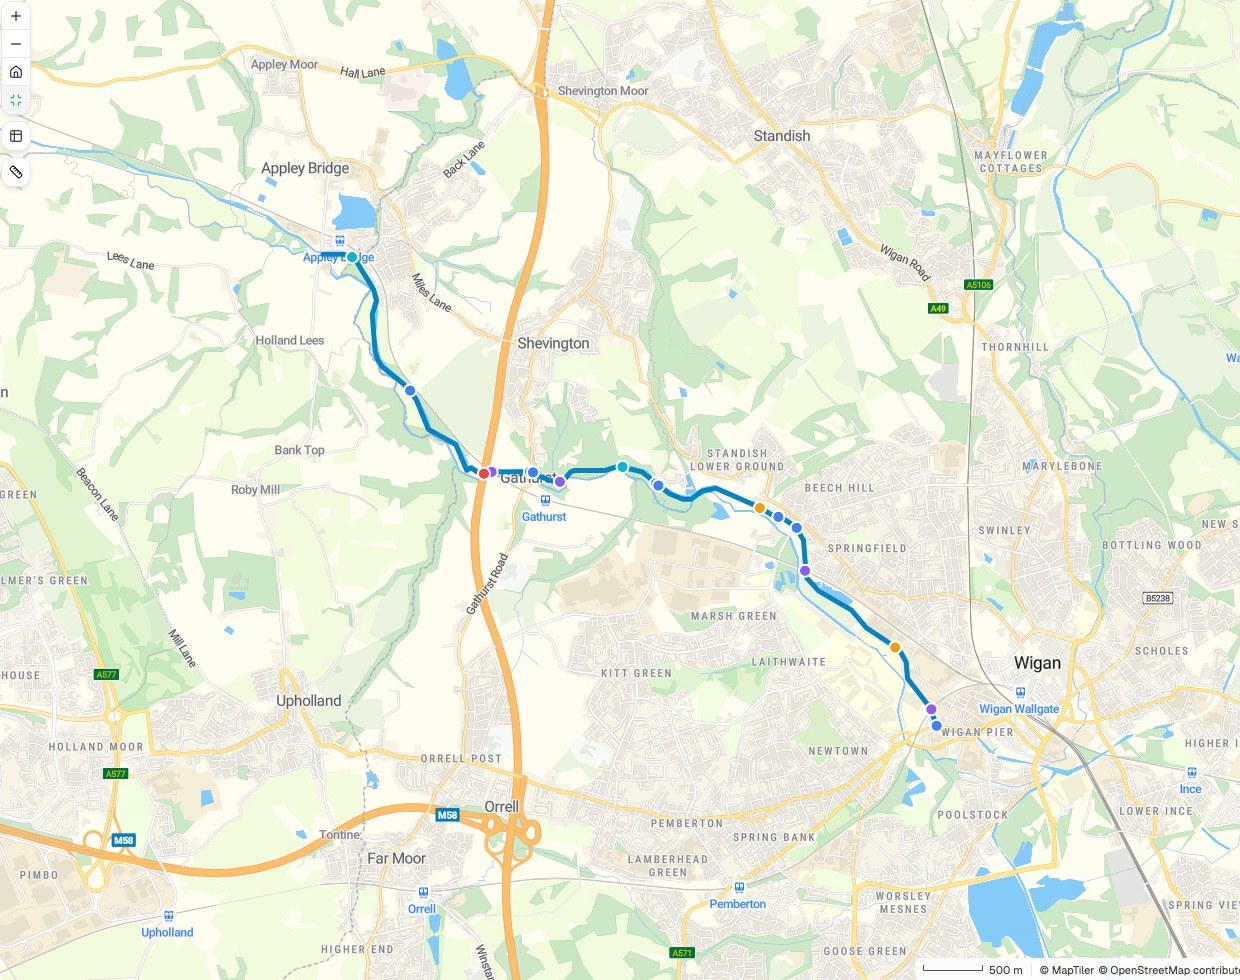
Everything the route crosses, in order
A civil engineering consultancy, taking a walking and cycling route into design
Infrastructure crossings
Numbered 1 to 17 along the route
- Road
- Railway
- Pipeline
- Waterway
- Motorway
- The route
The request
Attached is our preferred route. List everything it crosses, in order along it, with the distance from the start. Map each crossing by type.
What came back
- Seventeen crossings, each marked by type on the map
- A table in order along the route, with the distance to each
- The count for each type: roads, railways, waterways, pipelines
Goes toThe design team and the client’s engineers.
Mapstack finds and lists the crossings, while your engineers decide whether the route stands.
A survey the client can open
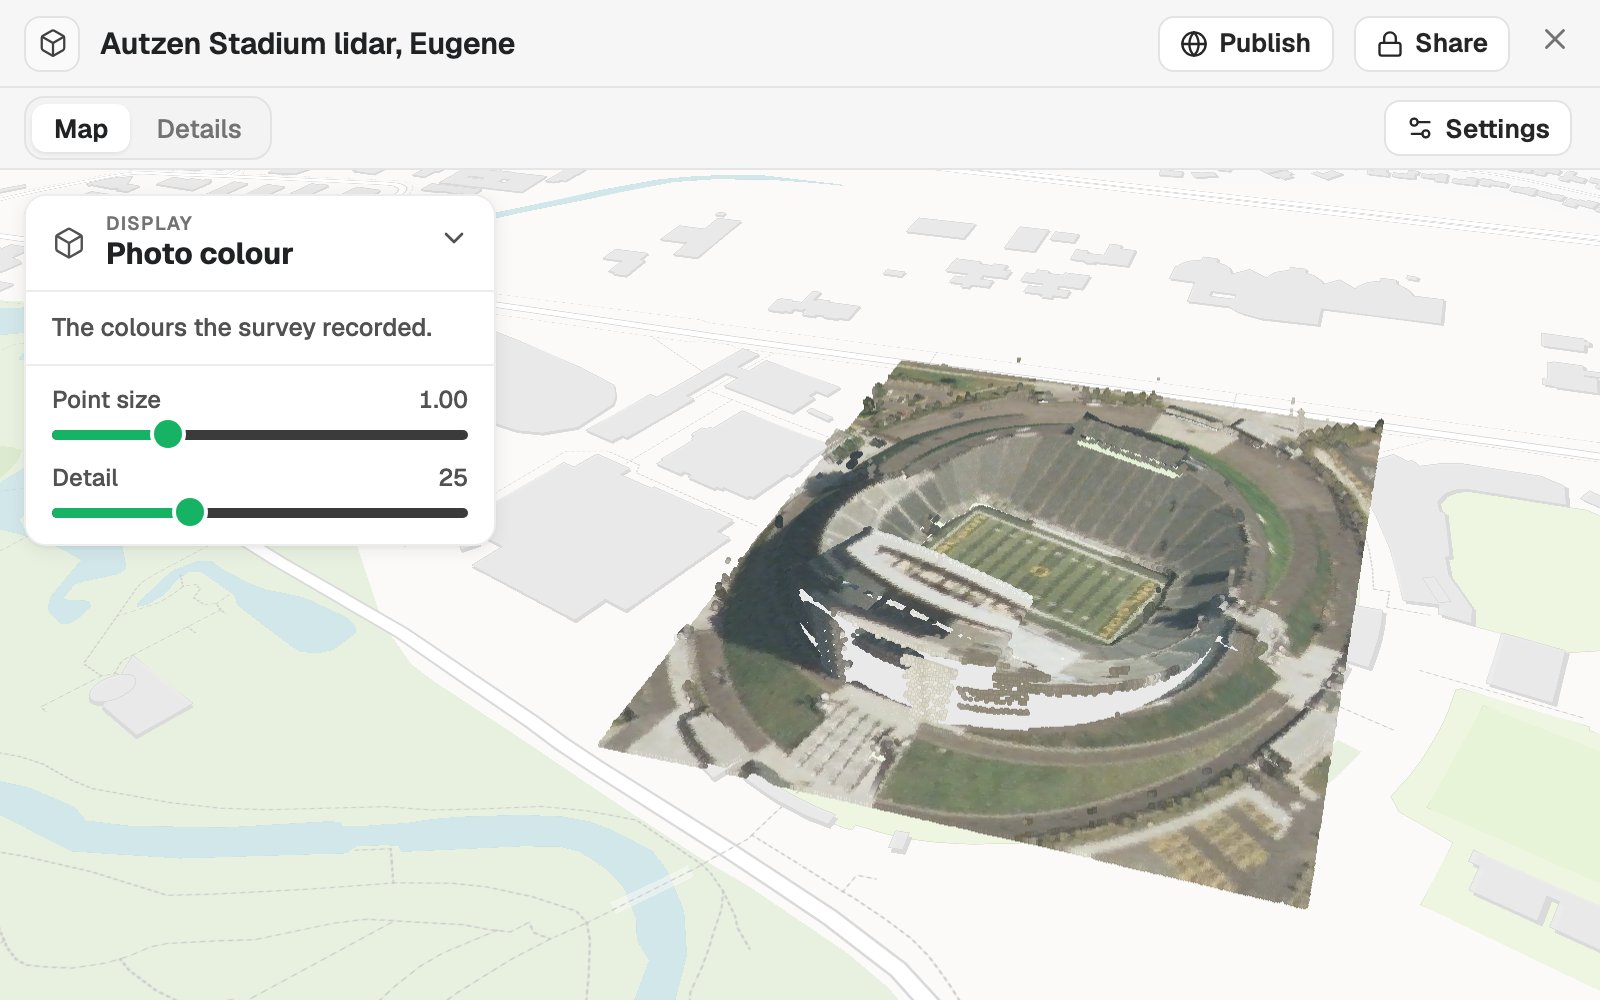
A survey firm, handing over a lidar survey of a stadium in Eugene, Oregon
The request
Attached is the survey as a LAZ file. Put it on a map in the colours it recorded, so the client’s team can look round it in a browser.
What came back
- The survey placed from its own coordinate system
- Views by photo colour, by height and by class
- A link the client opens without any software
Goes toThe client’s engineer and the site owner.
Mapstack puts the survey in front of the client, while the surveyor stands behind the data and its accuracy.
An example of how it goes
Four project managers asked this week. None of them waited.
Rosa is the GIS consultant in a planning and engineering office, and every project manager sends her work. This week a planner has a new site, an engineer has a route, a client wants to see a survey, and a boundary is about to move.
- site-boundary.gpkg
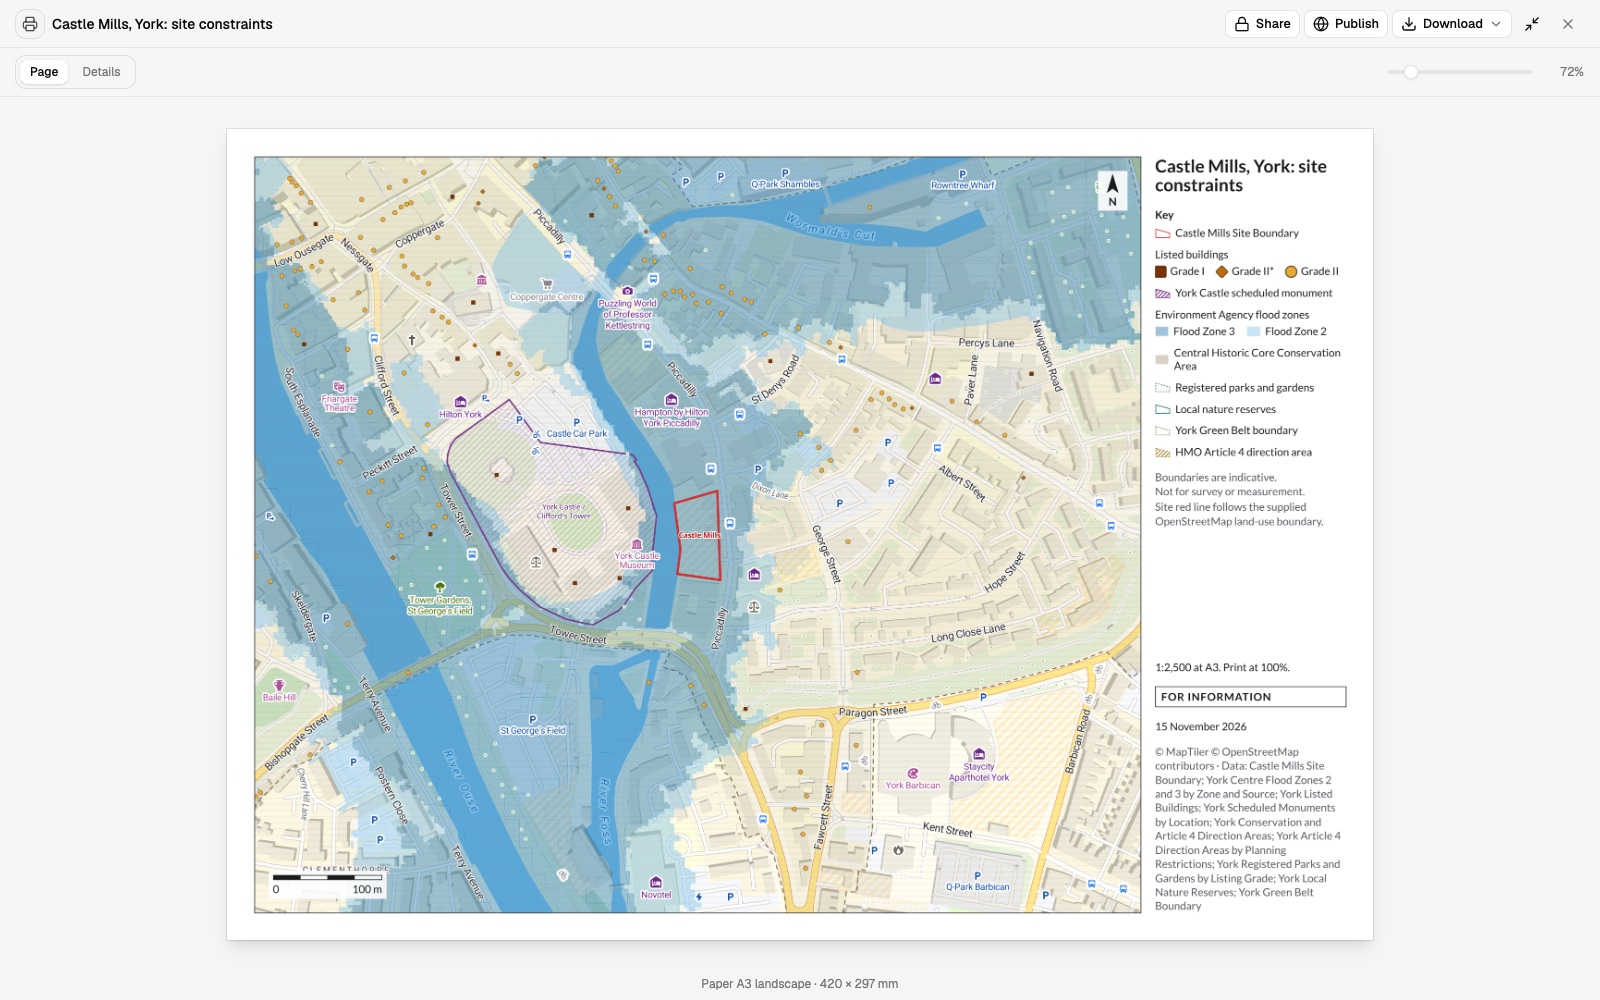
What is on and around the attached site? Put it on an A3 plan at 1:2,500.
Monday 9:30
The planner asks first
One sentence, the site boundary and the constraint layers. Rosa hands it to Mapstack and opens the next request.
Monday 9:50
The plan is back
To scale on A3, with the key, the scale bar and the sources in place for her to check.
- Everything the route crosses
Now a different job: list everything the attached route crosses, in order.
Monday 11:15
The engineer is next
A different question on different data, asked the same way. The survey for the client follows.
- Everything the route crossesBack with the project managers
A plan, a crossings table, a survey link
Each checked by Rosa and signed off by the professional who owns it
Thursday 3:10
The project managers take over
The site boundary moved on Wednesday, so the plan went back to the planner as the next revision. Each of them checks what is theirs.
Rosa spent the week checking work, not drawing it.
Each project manager got an answer while the question was still live. The planner, the engineer and the surveyor made the calls that were theirs to make.
Works with what your projects already produce
Boundaries, surveys and field data arrive in their own formats. Your GIS and your CAD stay where they are.
- What you bringFrom the project folder, as it is.
- Site boundariesRoutes and corridorsField survey dataOrthomosaics and point cloudsClient and regulator datasets
- What Mapstack finds for youPublished data, fetched when you ask and named on the figure.
- Census figuresBoundaries and base mappingRoads, railways and waterwaysOpen data from public bodies
- What you issueIn the form the reader expects.
- Figures and plans as PDF, to scaleTables and listsData in formats your GIS opensA project map the client can open
Yours to check, yours to sign
Liability sits with the professional who signs. So nothing here is taken on trust.

- Mapstack does not design, survey or estimate. It does not draw the scheme, fix a boundary, set out a site or price the works. It maps and measures from the data it is given.
- A professional signs, not Mapstack. The engineer, planner or surveyor of record checks what comes back and makes the judgement.
- Sources and dates on every figure. Which layer, from whom and when, with the scale stated on the sheet.
- The method is written out. How a distance was measured or a count was made comes back with the result.
- Client data stays private. Project data stays in your workspace, is not used to train AI, and reaches a client only when you share it.
The parts of Mapstack project teams use most
One teammate, whichever project is asking.
Analysis
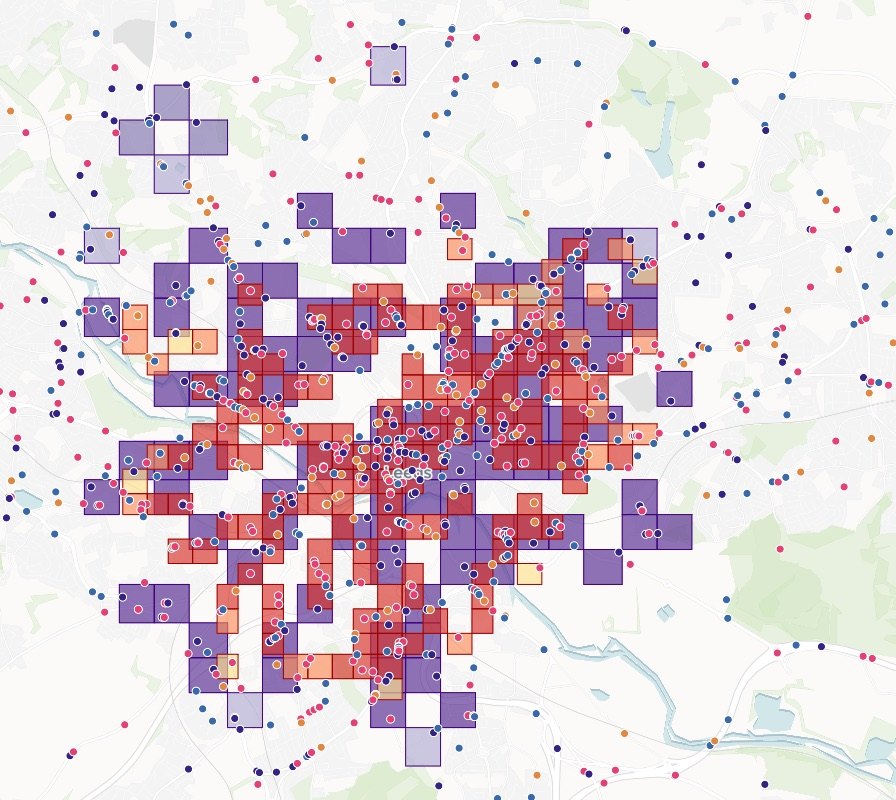
What covers a site, what a route crosses, how far.
Reports and print maps
Figures and plans to scale, with a title block.
Imagery and 3D
Elevation models and point clouds on a map.
Sharing
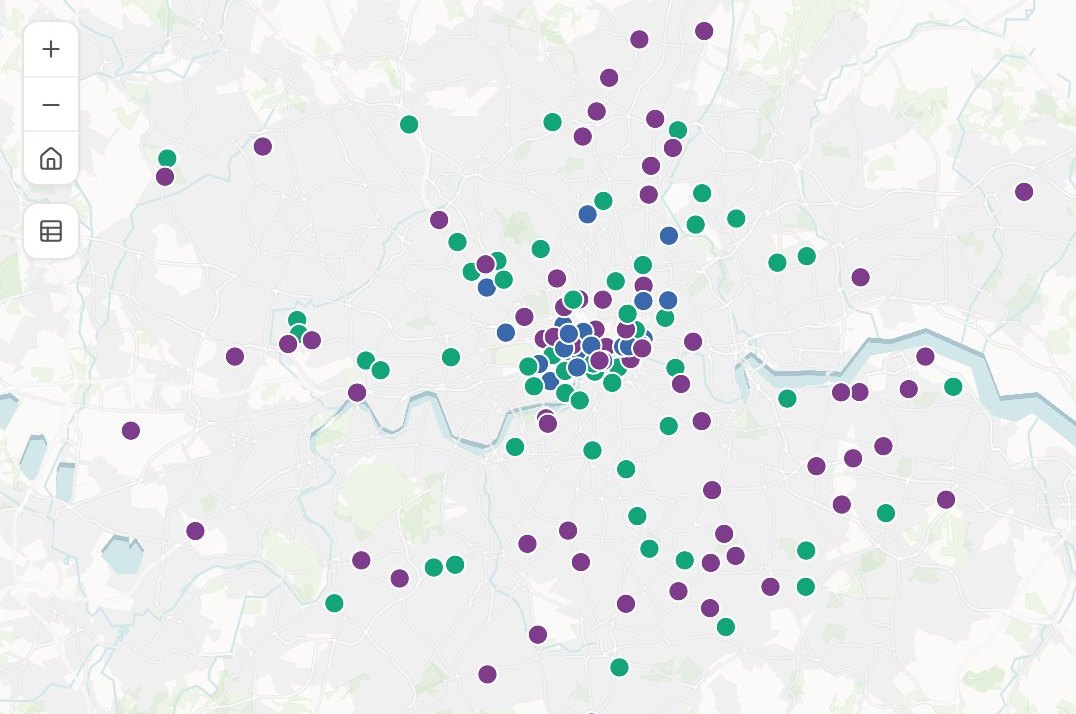
A project map the client can open.
Looking for a particular job? These go step by step.
- Map the constraints on and around a siteWhat covers the red line, how far the rest are, and an A3 plan.
- Find which of your sites sit in a flood zoneEvery site flagged with the zone it is in.
- Map the ecological baseline around a siteDesignated sites, priority habitat and species records within 2 km.
- Work out biodiversity net gain and carbon for a siteUnits before and after, the shortfall to 10%, and tonnes of CO2e.
- List everything a proposed route crossesEvery road, railway, river and pipeline, in order, with where and how far along.
- Price a route scheme at your own ratesLength, crossings, junctions and bus stops counted and costed, with a map.
- Choose where to drill from the borehole recordsYields read against the rock and the faults, and sites that keep your spacing rule.
- Put a lidar survey on a map, in 3DA point cloud in its own colours, by height or class.
- Show an elevation model as shaded reliefThe lie of the land under your boundaries.
- Make every figure in a report look like one setOne layout, revised by letter, and the next site.
- Turn a map into a figure that meets your standardA title block, a scale statement and a revision.
- Draw a figure-ground plan of a siteBuildings in black, at a stated scale.
What it costs
Mapstack is priced per person and free to start, with no minimum and no sales call.
Free
$0for one person
Ask about your own files. What comes back stays private to you until you choose to share it.
Creator
$16a person a month, billed yearly
Adds sharing with your team, reports and print sheets, and work that reruns without you.
Creator Max
$80a person a month, billed yearly
The same, with a larger monthly allowance for people who ask all day.
Colleagues who only need the answers take a Viewer seat at $10 a month. They open every result and ask it their own questions. See every plan.
Questions project teams ask
What GIS work can Mapstack do for an engineering or environmental consultancy?
Most of what a project asks a GIS specialist for: constraints around a site, what a route crosses, measurements and counts, report figures to scale, survey data on a map the client can open, and maps for a bid. You ask in plain words or in GIS terms, and your team checks the result.
Is it only for GIS staff?
No. It is for the GIS specialist and for the engineers, planners, scientists and project managers who wait on them.
Do we have to replace our GIS or our CAD?
No. Mapstack sits beside them. It reads the standard formats your GIS exports and hands data back in formats it opens. It is not a design tool and does not edit drawings or models.
Who is responsible for what it produces?
You are, as with any figure a colleague prepares. Mapstack names its sources and writes out its method so the professional of record can check the work before signing it.
Will a figure meet a regulator’s or a client’s standard?
Tell it what the standard requires, such as the sheet size, the scale, the layers and the title block, and it draws to that. The check against the standard, and the signature, are yours.
How do I produce a constraints plan for a planning application?
Attach the site boundary and the constraint layers, and name the distance, the paper size and the scale. Mapstack returns what covers the site, what is nearby and how far, on a plan with a key, north arrow, scale bar and sources.
Can it produce a whole figure set in one layout?
Yes. Brief the first figure, then ask for the next in the same layout. Each carries its figure number and revision, and is reissued by revision when something changes.
Can it show a drone or lidar survey to a client?
Yes. Finished survey outputs such as orthomosaics, elevation models and point clouds go on a map the client opens from a link. Mapstack does not fly the site or process the raw survey, and its measurements are not survey-grade.
Can it make maps for a bid?
Yes: project location and context maps on a clean base, sized for a slide or a document.
Is the data I upload private?
Yes, on every plan, Free included. Your files and everything made from them are private to your workspace by default. Nothing is public unless you choose to publish it, and you can make it private again.
What happens to my data?
It stays in your workspace and it stays yours. Only the people you give a seat to can see it. It is stored in the United States, it is not used to train AI, and when you delete it, it is removed.
Ask about the site you are working on.
Free to start. No card.