
Customer data enrichment
Add the income and age around every account.
Attach a list of customer addresses. You get the list back with each area's income, age and household size added, and the customers on a map.
Free to start. No card.
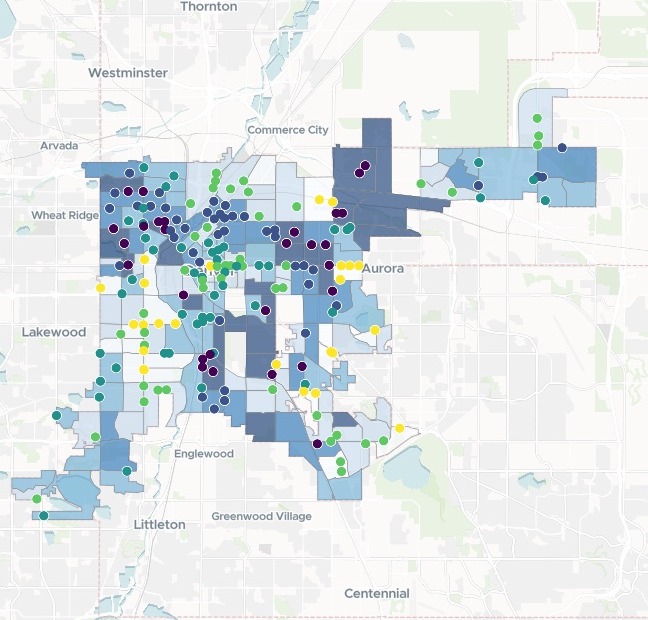
| Tract median household income | Income |
|---|---|
| Highest | $138k and up |
| High | $108k–138k |
| Middle | $85k–108k |
| Low | $61k–85k |
| Lowest | Under $61k |
Every account placed from its street address alone.
For anyone who sells through accounts
Distilleries, brands, wholesalers: you know every account by its address, not its neighbourhood.
The census does. A census tract is a small area the Census Bureau publishes figures for, and its American Community Survey gives each tract a median income, a median age and an average household size.
Adding those demographics to each row is data enrichment. It is how you split accounts into segments and decide which store gets which product or promotion.
Your list in, the same list back, three columns longer
Columns: Store (the account), Address (number and street), City (the city), State (two letters), ZIP (five digits). 217 rows. Street addresses only, no coordinates.
What you get
- Every column you sent, as it was.
- The census tract, by name and code.
- The tract figures: median household income, median age, average household size.
- A map of the accounts coloured by income, with every added figure in the pop-up.
One real account list
Filled in, and every gap named
Denver's licensed liquor stores, from the Colorado Department of Revenue, standing in for a distillery's account list. Mapstack fetched the tract figures itself.
- In Denver tracts
- 193accounts matched to the census tract they sit in
- Tracts fetched
- 178each with its median income, median age and household size
- Offered next
- 3neighbouring counties it offered to fetch next, to fill in the rest
- All three figures
- 190
- Age and household size only
- 3
- Outside the county it fetched (not filled)
- 24
It says why a row is empty.
Three stores have no income figure: the Census Bureau publishes none for their tracts. The 24 outside Denver sit in the neighbouring counties it offered to fetch next.
Accounts: Colorado Department of Revenue, liquor licences in Colorado, retail liquor stores in Denver, 14 November 2026. Figures: US Census Bureau, American Community Survey 5-year estimates, 2019–2023, by Denver census tract. Run on 14 November 2026.
How it goes
You bring the list. Mapstack places it and adds the figures.
Attach the list and name the figures.
Mapstack places every account by geocoding its address, and colours it by income.
You get the list back.
Common questions
What happens to my account list?
It stays in your workspace. Only people with a seat in your workspace can see it. Nothing leaves unless you publish it yourself.
It is not used to train AI. Your data and your conversations are not used to train AI models.
It is still yours. You keep ownership of what you bring in. Delete it and it is removed.
The full answer is in the documentation: Your data, privacy and security.
What does it cost?
Free to start. One seat, for you, with a starter amount of work each month. No card.
This job is on the free seat. Maps, datasets, analysis, your own files and public sharing are all included.
Pay per person for more. A paid seat brings more work each month, and seats for your team.
The prices are on the pricing page.
What comes back?
The same list, longer. Every row you sent, with its tract and figures added.
The rows it could not fill. Named, with the reason.
A map. Your accounts over the tracts, with search, a table and filters.
Enrich yours.
Free to start. No card.