
A property infographic
Put your site and its selling points on one page.
Attach the site’s row from the register. You get an A4 one-pager with the site on a map, the distance to each station, and who lives within 1 km.
Free to start. Print-ready one-pagers on a paid seat.
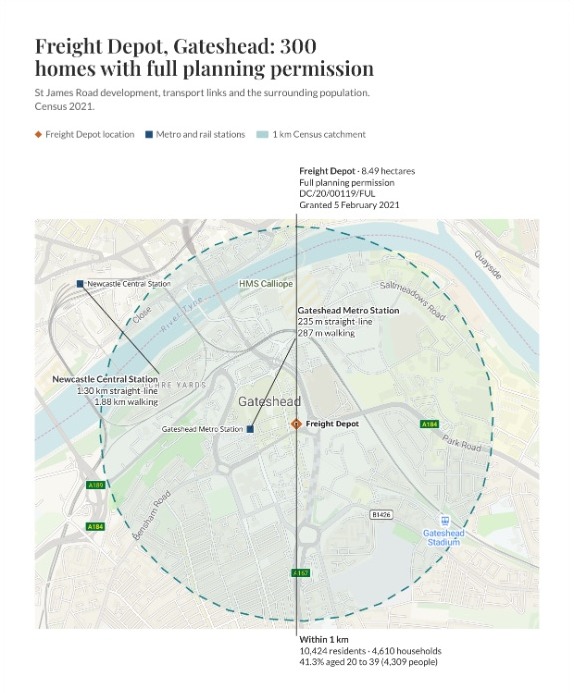
| On the sheet | Drawn as |
|---|---|
| Freight Depot | Diamond |
| Metro and rail stations | Square |
| 1 km Census catchment | Dashed ring |
The planning facts come from the register row. The distances and the Census figures are worked out for you.
For whoever has a site to sell
Regeneration teams.Land agents.Estates teams.
A site with permission still has to find a builder, and developers want the case on one page.
That page is the site on a map, what is permitted, how close the stations are and who lives nearby, set out so a developer takes it in at a glance.
Here you attach the site’s row from the brownfield land register, the council’s public list of previously developed land.
From one register row to the page
Columns: Address (the site), Hectares (its area), Consent (its kind and date), Homes (how many), Notes (the reference), Point (where it is). 1 row. One row of the brownfield land dataset as planning.data.gov.uk publishes it, with its other columns left in.
What you get
- The site on a map at the register’s point, with the stations and a ring around it.
- The planning facts from the row: size, permission, reference, date and homes.
- The distance to each station, in a straight line and on foot.
- Who lives nearby: people, households and ages, from the 2021 Census.
- An A4 portrait sheet with your title, a key and callouts beside the places they describe.
One real site
Who lives around the site, and how far the trains are
The Freight Depot on St James Road, Gateshead: publicly owned, 8.49 hectares, with full planning permission for 300 homes. The register row went in; Mapstack found the stations and the Census figures itself.
- Within 1 km
- 10,424residents around the site
- Households
- 4,610in the same ring
- Aged 20 to 39
- 41.3%of those residents: 4,309 people
| Station | Straight line | On foot |
|---|---|---|
| Gateshead Metro station | 235 m | 287 m |
| Newcastle Central | 1.30 km | 1.88 km |
It gives the walk as well as the line.
For each station Mapstack measured the straight line and the walk along the streets, and printed both on the sheet. Newcastle Central is across the river, so its walk runs over the Tyne bridges.
Site: brownfield land register, Gateshead entry HLC5, from planning.data.gov.uk (Open Government Licence). Stations: Tyne and Wear train and Metro stations, found by Mapstack and placed from OpenStreetMap. People and households: Census 2021, from the output areas the ring crosses, apportioned to the part inside it. Run on 15 November 2026.
How it goes
You bring the row. Mapstack finds the rest and lays out the page.
Attach the register row and say what the page should hold.
Mapstack lays out the sheet with the map and the facts beside it.
You send it out.
Common questions
What happens to our site data?
It stays in your workspace. Only people with a seat in your workspace can see it. Nothing leaves unless you publish it yourself.
It is not used to train AI. Your data and your conversations are not used to train AI models.
It is still yours. You keep ownership of what you bring in. Delete it and it is removed.
The full answer is in the documentation: Your data, privacy and security.
What does it cost?
Free to start. One seat, for you, with a starter amount of work each month. No card.
The map, the distances and the Census figures are on the free seat. With your own files and public sharing.
The one-pager as a PDF or PNG is on a paid seat. Paid seats are per person, and bring more work each month.
The prices are on the pricing page.
Can we change it after?
Say what to change. Move a station, or the point the distances are measured from.
The figures follow. The distances and the Census counts are worked out again.
The same sheet comes back. Everything you did not mention stays as it was.
Make yours.
Free to start. Print-ready one-pagers on a paid seat.