
Lidar on a map
Put your lidar survey on a map, in 3D.
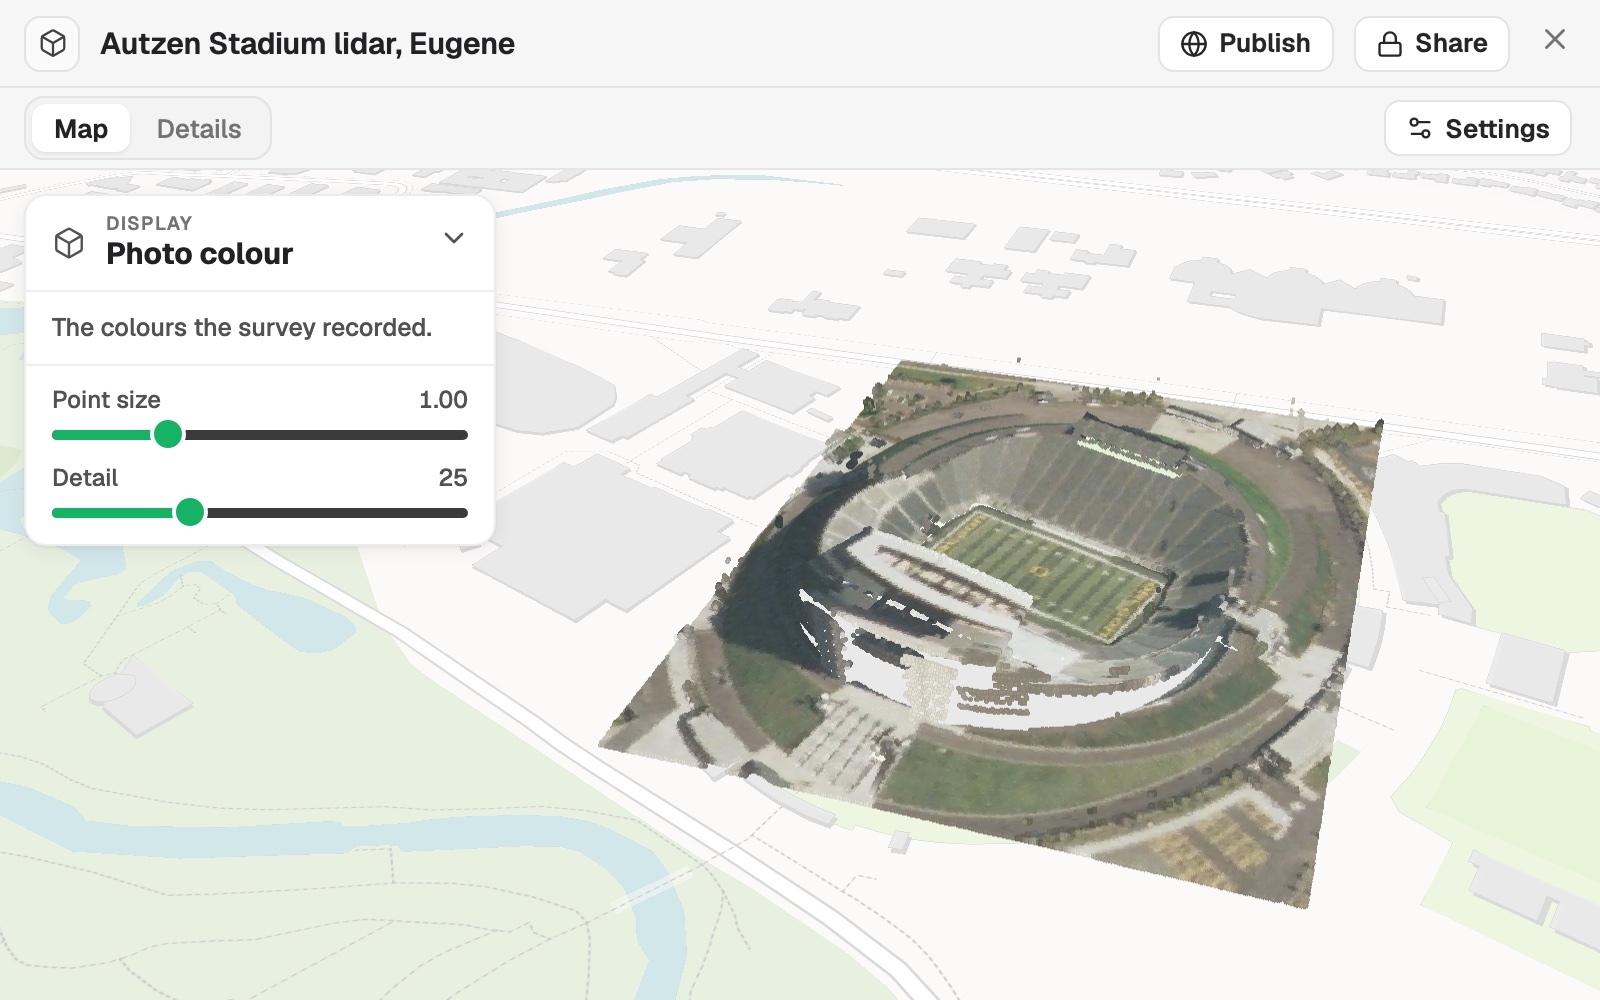
Upload a point cloud. You get it standing on a 3D map among the streets around it, in the survey's colours, by height or by class.
Point clouds are on a paid seat.
| The survey | |
|---|---|
| Points | 693,895 |
| Size on the ground | 302 × 349 m |
| Coordinate system | UTM 10N |
Read from the file: NAD83 / UTM zone 10N.
For anyone with a survey to show
A site.A building.A corridor.
The survey is millions of points, and the people who need to see it do not have a point cloud viewer.
Here the survey stands on an ordinary map, among the streets around it, and goes on a map beside your other data as a layer.
Mapstack reads the coordinate system from the file and converts the survey into a scene in your library.
One real survey
693,895 points, in their own colours
An airborne lidar survey of Autzen Stadium in Eugene, Oregon: a public sample file from the PDAL project, 2.7 MB of LAZ, with a colour recorded for every point.
- The file
- 2.7 MBof LAZ, a colour recorded for every point
- Classes
- 2in the survey, each with a box to hide it
- Ground
- 28%of the points, the rest unassigned
| Points by class | Share |
|---|---|
| Unassigned | 72% |
| Ground | 28% |
Display by class lists the classes with their share of the points. Unassigned means the survey did not classify those points.
Each has a box to hide it. Display by height colours the points on a ramp from low to high.
PDAL project sample data, Autzen Stadium airborne lidar. Run on 10 November 2026.
Show it another way
Open Display, or say it.
Ask for a map and the scene goes on it as a layer beside your other data, in the same colours unless you name others.
Now show it by height.
The points are coloured on a ramp from low to high. Point size and Detail set how solid the cloud looks.
How it goes
The conversion shows its progress and can be cancelled.
Upload the survey.
It stands on the map among the streets around it.
You show it by height or class.
The step-by-step guide is in the documentation: Put a lidar point cloud on a map in its own colours, or by height or class.
Common questions
What does it cost?
Point clouds and 3D scenes are on a paid seat. Paid seats are per person, and bring more work each month.
Free to look around. Maps, datasets and analysis are on the free seat. No card.
The prices are on the pricing page.
What happens to my survey?
It stays in your workspace. Only people with a seat in your workspace can see it. Nothing leaves unless you publish it yourself.
It is not used to train AI. Your data and your conversations are not used to train AI models.
It is still yours. You keep ownership of what you bring in. Delete it and it is removed.
The full answer is in the documentation: Your data, privacy and security.
Show yours.
Point clouds are on a paid seat.