
Official boundaries, by name and year
Get official boundaries in the edition you need.
Name the areas and the edition. You get the official boundaries with their codes and names, and the source, date and licence of each part.
Free to start. No card.
| Fetched, no file attached | |
|---|---|
| Areas, each with its official code | 680 |
| Residents, all wards | 8,799,716 |
| Edition | 2022 |
London's 679 wards and the City of London, which the ward figures treat as one area.
For anyone who reports by area
Figures only line up with shapes from the same edition.
Boundaries are redrawn between censuses, and wards between elections.
Many London boroughs redrew their wards for the 2022 elections. A ward table from before then will not line up with these shapes, even where the names look the same.
Here you name the areas and the year. Mapstack says which edition it used, where it came from, and its licence.
One real request
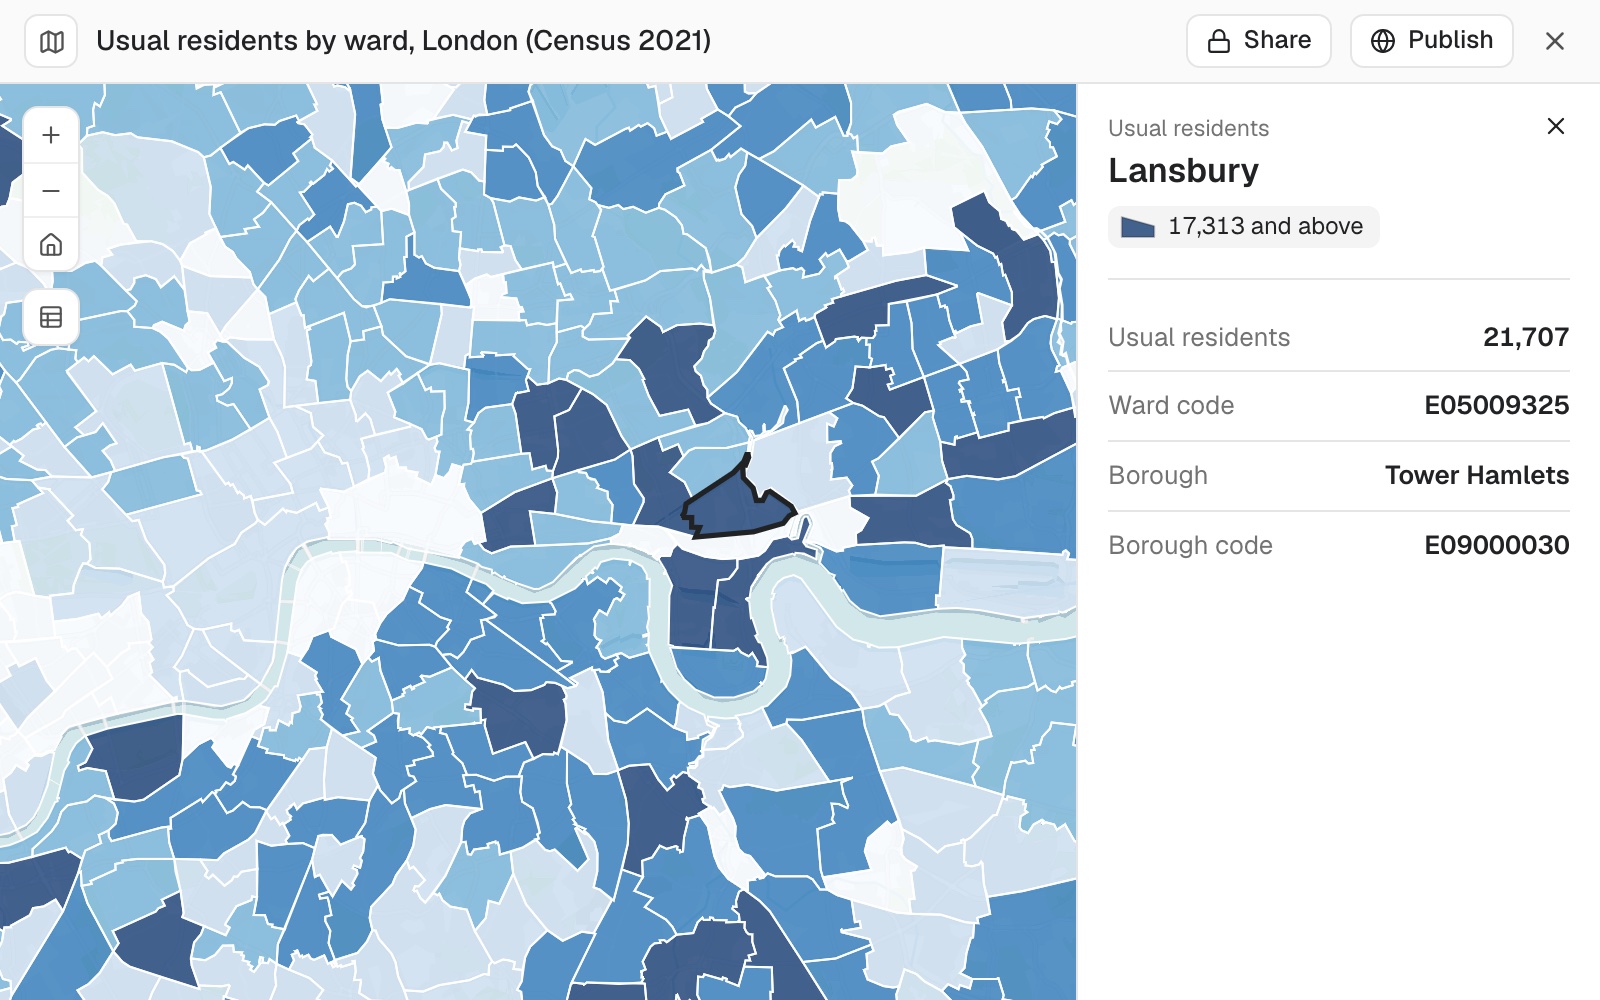
680 areas, 8,799,716 residents, 12 short of the published total
London's 2022 wards, the edition the Office for National Statistics publishes Census 2021 ward figures for, with the usual resident population of each.
- Areas
- 680the 679 wards and the City of London, each with its official code
- Published total
- 8,799,728usual residents in London
- The gap
- 12residents between the wards added up and the published total
| Usual residents, Census 2021 | Residents |
|---|---|
| Hendon, Barnet, the largest | 21,981 |
| Abbey, Barking and Dagenham, the smallest | 3,955 |
The wards add up to 12 short of the published total.
Small-area counts are adjusted slightly to protect privacy, so they need not add up exactly to the figure published for the whole city: here, 12 short of 8.8 million.
Office for National Statistics: wards, December 2022; Census 2021 table TS001, usual residents. Open Government Licence. Run on 11 November 2026.
Ask where each part came from
Every input has a source, a release and a licence. Your credits need all three.
Each area carries the codes and names of the larger areas it sits in, so a ward-to-borough lookup is one ask.
What source, date and licence is each of these from?
Mapstack listed every input with its source, release and licence: here, the ward boundaries and the population, both from the Office for National Statistics under the Open Government Licence.
How it goes
No file needed. Name the areas, the edition and the figures.
Name the areas and the year.
Mapstack fetches them and adds the figures.
You get the codes, and the area each sits in.
The step-by-step guide is in the documentation: Get official boundaries and the figures that go with them, by name and year.
Common questions
What does it cost?
Free to start. One seat, for you, with a starter amount of work each month. No card.
This job is on the free seat. Maps, datasets, analysis, your own files and public sharing are all included.
Pay per person for more. A paid seat brings more work each month, and seats for your team.
The prices are on the pricing page.
Where does it look?
Your workspace first. Then the Community Library, then official sources.
It says what it used. The edition, the source and the coordinate system of the shapes.
Places too. Schools, shops and the like from Overture Maps, counted into your areas.
Get yours.
Free to start. No card.