
Health disparities by census tract
See how far health follows income, tract by tract.
Attach a health measure by census tract. You get income added to each tract, how strongly the two go together, and a map of both at once.
Free to start. Written reports on a paid seat.
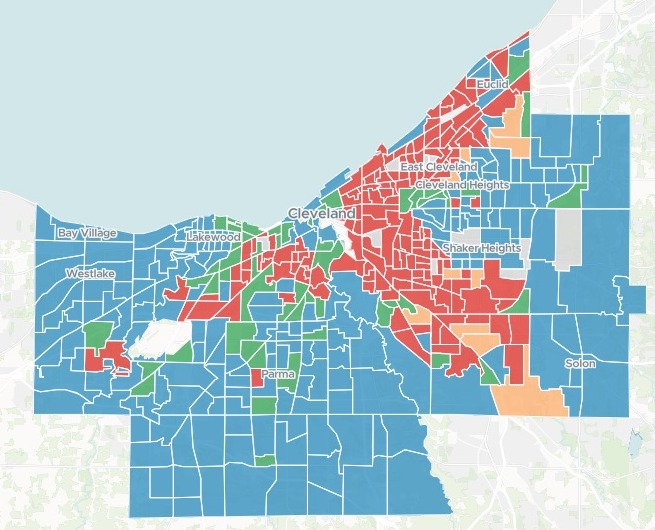
| Income and diabetes together | Tracts |
|---|---|
| Higher income, less diabetes | 196 |
| Lower income, more diabetes | 152 |
| Lower income, less diabetes | 54 |
| Higher income, more diabetes | 10 |
| No income figure | 10 |
Red runs through Cleveland and its eastern inner suburbs; blue covers the outer suburbs.
For whoever writes the community health assessment
Epidemiologists, health equity analysts and hospital needs assessment teams.
The gradient by neighbourhood goes in the report, and so do the places that buck it.
Health disparities often show as a gradient: the lower the income, the worse the measure. The correlation says how closely one follows the other. The map says where it does, and where it does not.
A map that shades each area by two measures at once is a bivariate map. Here every tract falls in one of four classes: higher or lower income, against more or less diabetes.
One real county
A strong relationship, and the tracts that break it
CDC PLACES estimates of adults with diagnosed diabetes, 2025 release, for every census tract in Cuyahoga County, Ohio. Mapstack fetched median household income for the same tracts from the American Community Survey itself.
- Direction
- Inverselower-income tracts consistently have more adults with diabetes
- Strength
- −0.695the correlation, r, between income and diabetes: strong. R² ≈ 0.483
- The split
- $60,376the median across the county’s tracts, where the two lists divide
| Tract | Diabetes | Income |
|---|---|---|
| Tract 1401 | 21.1% | $62,737 |
| Tract 1957 | 18.6% | $66,002 |
| Tract 1217 | 17.9% | $73,889 |
| Tract 1077.01 | 5.3% | $58,864 |
| Tract 1968 | 6.5% | $37,474 |
| Tract 1606.03 | 7.0% | $42,400 |
It names the exceptions the way you define them.
In orange, the first three above the median income with the most diabetes; in green, the first three below it with the least. Each list ran to ten.
US Centers for Disease Control and Prevention, PLACES: Census Tract Data, 2025 release, Cuyahoga County, Ohio. Median household income: US Census Bureau, American Community Survey 2019–2023 5-year estimates, table B19013. Run on 15 November 2026.
You bring one measure. Mapstack fetches the other.
Columns: Census tract (its code), Population (people living there), Diabetes (share of adults diagnosed). 422 rows. No income in the file. Naming it was enough.
What comes back
- Median household income for every tract, from the American Community Survey 2019–2023, joined on the tract.
- How strongly the two go together, as one figure and in plain words.
- One map of both, with a scatterplot and trend line, charts by class and a searchable table beside it.
- Notes on the data: the sources, and which tracts had no income figure and why.
How it goes
Attach your figures by tract and name the measure to set them against.
Mapstack maps both at once.
You get the exceptions, ranked.
Common questions
What happens to the figures I attach?
It stays in your workspace. Only people with a seat in your workspace can see it. Nothing leaves unless you publish it yourself.
It is not used to train AI. Your data and your conversations are not used to train AI models.
It is still yours. You keep ownership of what you bring in. Delete it and it is removed.
The full answer is in the documentation: Your data, privacy and security.
What does it cost?
Free to start. One seat, for you, with a starter amount of work each month. No card.
The map, the measures and the lists are on the free seat. With your own files and public sharing.
The written report is on a paid seat. Paid seats are per person, and bring more work each month.
The prices are on the pricing page.
How is the strength measured?
A correlation, r. It runs from −1 to 1. Near −1, one falls as the other rises; near 0, there is no straight-line link.
R², the share explained. How much of the difference between tracts in one measure the other accounts for.
The exceptions, by your rule. Name where to split and how to rank, and the lists follow it.
Test yours.
Free to start. Written reports on a paid seat.