
Safe routes to school
Rank your schools by the crashes around them.
Attach your injury collisions, schools and crossings. You get the schools ranked by crashes nearby that hurt someone on foot or a bike, and where those crashes cluster.
Free to start. No card.
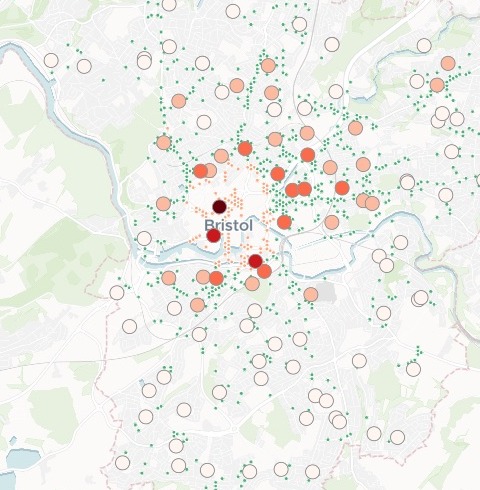
| Schools, by collisions around them | Rank |
|---|---|
| Willow Park CofE Primary | 1st |
| The next three | 2nd to 4th |
| The next ten | 5th to 14th |
| The rest, paler | 15th on |
| Hot spot, crossing nearby | |
| Grid cell, no hot spot |
The darkest schools and the crash hot spots sit together in the city centre.
For whoever decides which school is next
There is money for a few schemes this year and more schools asking than you can help.
The crash record says where to start.
Road safety officers, school travel planners and highway engineers choose which schools get crossings, 20 mph zones or School Streets. The police record of every injury collision is the evidence they reach for.
Here you attach the record, the schools and the crossings, and ask once: the ranking, the clusters and the map come back together.
One real city
Bristol's schools, ranked by the crashes around them
Five years of police-recorded injury collisions in Bristol (STATS19), 2021 to 2025, the Department for Education's list of the city's open schools, and the pedestrian crossings mapped in OpenStreetMap.
- Top of the list
- 152collisions near Willow Park CofE Primary that hurt someone on foot or a bike, the most of any school
- Children hurt
- 7collisions near Cabot Primary, the most of any school in the top 15
- Hot spots
- 140places near schools where these crashes cluster more than chance
| School | Collisions | Serious or fatal |
|---|---|---|
| Willow Park CofE Primary | 152 | 26 |
| Bristol Cathedral Choir School | 98 | 18 |
| Cathedral Primary | 98 | 18 |
| St Mary Redcliffe and Temple | 78 | 16 |
| Cabot Primary | 66 | 12 |
| E-ACT Montpelier High | 62 | 8 |
It finds where the crashes cluster, and checks each cluster for a crossing.
A hot spot analysis on a grid tested every cell near a school against its neighbours. Each hot spot was then checked for a pedestrian crossing within 50 metres.
Department for Transport, Road Safety Data (STATS19), Bristol, 2021 to 2025. Department for Education, Get Information About Schools, 14 November 2026. Crossings © OpenStreetMap contributors, 15 November 2026. Run on 15 November 2026.
Your collision record goes in. A ranked list and a map come back.
Columns: Latitude, longitude (where it happened), Date, time (when), On foot or a bike (how many hurt), Children (how many of them), Serious or fatal (how many of them). 4,111 rows. With it, the list of schools and the crossings, each with its coordinates.
What you get
- Every school ranked by the collisions within 500 metres, with children hurt and deaths and serious injuries beside each.
- The hot spots near schools, each tested against its neighbours and given its confidence.
- A crossing check for every hot spot: is there one within 50 metres?
- One map: the schools shaded by their count, the hot spots, the collisions by severity and the crossings by type, with a search by school name.
How it goes
You bring the three files and say what counts. Mapstack does the counting, the testing and the map.
Attach the files and say what to count, and how near.
Mapstack ranks the schools and maps them with the hot spots.
You get the list, school by school, with its street and reference number.
Go further
The same collisions answer the next questions on the list.
When
The time of every crash is in the record.
- Split the collisions near the top five schools by day of the week.
Who
Rank by the people your scheme is for.
- Count only the collisions where someone was killed or seriously injured.
Next year
Keep the ranking current as the record grows.
- Here is this year's collisions. Run the same ranking again and tell me which schools moved up or down.
Common questions
What happens to our collision data?
It stays in your workspace. Only people with a seat in your workspace can see it. Nothing leaves unless you publish it yourself.
It is not used to train AI. Your data and your conversations are not used to train AI models.
It is still yours. You keep ownership of what you bring in. Delete it and it is removed.
The full answer is in the documentation: Your data, privacy and security.
What does it cost?
Free to start. One seat, for you, with a starter amount of work each month. No card.
This job is on the free seat. Maps, datasets, analysis, your own files and public sharing are all included.
Pay per person for more. A paid seat brings more work each month, and seats for your team.
The prices are on the pricing page.
How does it count?
A 500-metre ring round each school. Every collision inside it that hurt someone on foot or a bike counts.
Ties go to children. Schools level on collisions are ranked by children hurt, then by deaths and serious injuries.
Overlaps are named. In Bristol, 114 of the 126 rings overlap a neighbour’s by 10% or more, so one crash can count for two schools.
Rank yours.
Free to start. No card.