
Supply chain risk: supplier exposure
See which of your factories a storm reached.
Attach your supplier list and the storm's published wind zones. You get every factory in its strongest zone, the workers added up by zone, and a map.
Free to start. Printable maps on a paid seat.
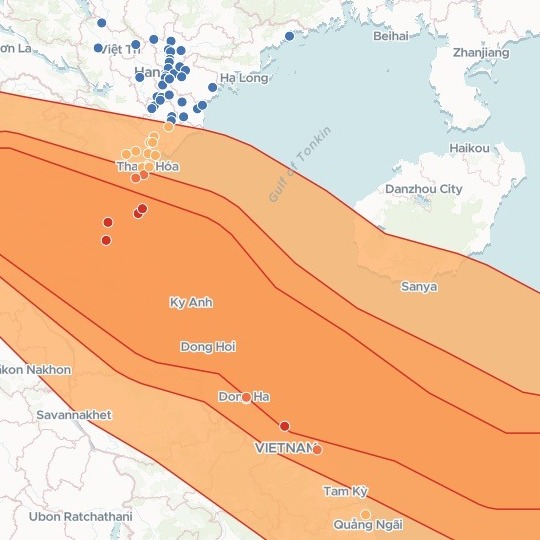
| Strongest wind at each factory | Factories |
|---|---|
| 120 km/h zone | 5 |
| 90 km/h zone | 4 |
| 60 km/h zone | 11 |
| Outside the wind zones | 70 |
The orange bands are the wind zones. Each factory counts once, in the strongest it was in.
For whoever answers for the supply chain
A typhoon comes ashore where you make your goods.
Buyers, the board and the brand team all ask the same thing: which of our factories were in it, and how many people work there?
Supply chain risk work starts with supplier exposure: which suppliers sat inside a hazard, and how hard it hit them. For a tropical cyclone, GDACS, the Global Disaster Alert and Coordination System, publishes wind zones: the areas where its winds reached set speeds.
One real storm
8,520 to 21,000 people work in the factories the storm reached
Typhoon Bualoi hit north-central Vietnam in late September 2025. The wind zones GDACS published for it, against a clothing retailer's published list of its supplier factories in Vietnam.
- Most factories
- Thanh Hoathe province with 10 of the factories in the storm
- Strongest winds
- Nghe Anthe province with 4 of the factories in the 120 km/h zone
- In the storm
- 20of the 90 factories were inside its wind zones
| Strongest wind | Workers, fewest to most |
|---|---|
| 120 km/h zone | 2,005 – 5,000 |
| 90 km/h zone | 2,004 – 4,000 |
| 60 km/h zone | 4,511 – 12,000 |
Workers counted as far as the bands allow.
The list gives each factory a band of workers, such as 501–1,000, not a headcount. Mapstack added up the fewest and the most each band allows, zone by zone.
Wind zones: GDACS (European Commission Joint Research Centre and UN OCHA), Tropical Cyclone BUALOI-25, 23–28 September 2025. Factories: a clothing retailer's published supplier list for Vietnam, August 2026, placed with OpenStreetMap (© OpenStreetMap contributors). Run on 15 November 2026.
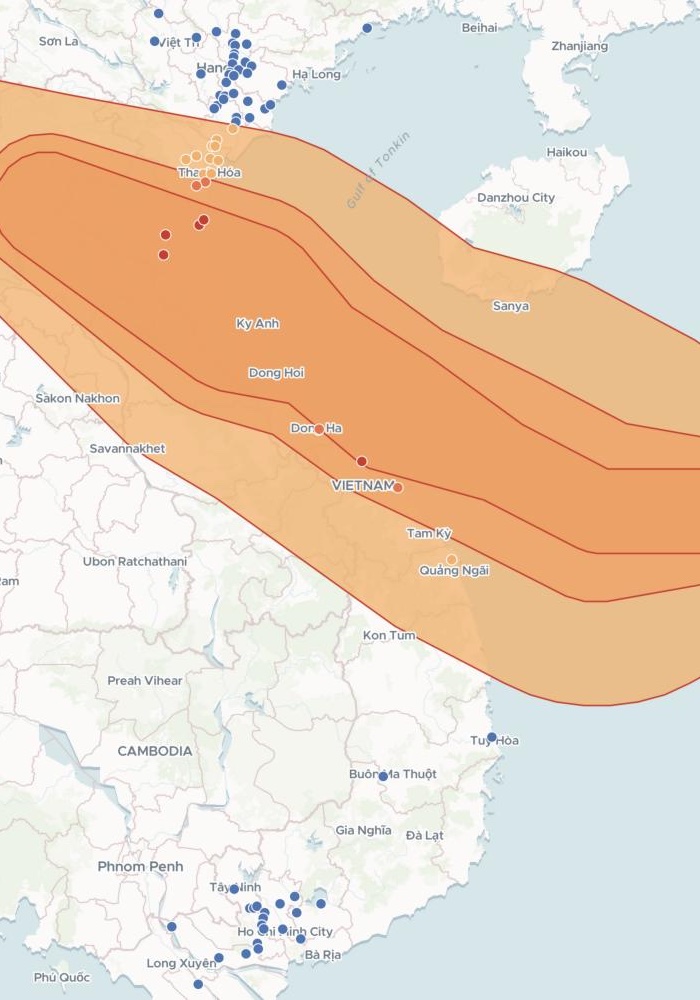
Every factory on one map, inside the storm or not
Most of the factories outside the storm sit around Hanoi in the north and Ho Chi Minh City in the south.
- A pop-up for each. Its address, supplier, what it makes, its workers and how closely it is placed.
- The storm across the middle. Its wind zones run from the South China Sea over north-central Vietnam into Laos.
How it goes
Attach your supplier list and the wind zones and say what you need back.
Mapstack checks every factory against the zones and maps them.
You get the list to hand on.
Common questions
What happens to our supplier list?
It stays in your workspace. Only people with a seat in your workspace can see it. Nothing leaves unless you publish it yourself.
It is not used to train AI. Your data and your conversations are not used to train AI models.
It is still yours. You keep ownership of what you bring in. Delete it and it is removed.
The full answer is in the documentation: Your data, privacy and security.
What does it cost?
Free to start. One seat, for you, with a starter amount of work each month. No card.
The list, the counts and the map are on the free seat. With your own files and public sharing.
The printable map is on a paid seat. Paid seats are per person, and bring more work each month.
The prices are on the pricing page.
How is each factory placed?
Where your list puts it. From the latitude and longitude in your file.
With how sure that is. Add a column saying how closely each is placed, and the answer names any factory that could fall either side of a zone's edge.
Check yours.
Free to start. Printable maps on a paid seat.