
Lead service line inventory
Map your lead service lines for residents.
Attach your service line inventory. You get a map residents can search by address, with every line coloured by lead status, and a count of each group.
Free to start. Reports on a paid seat.
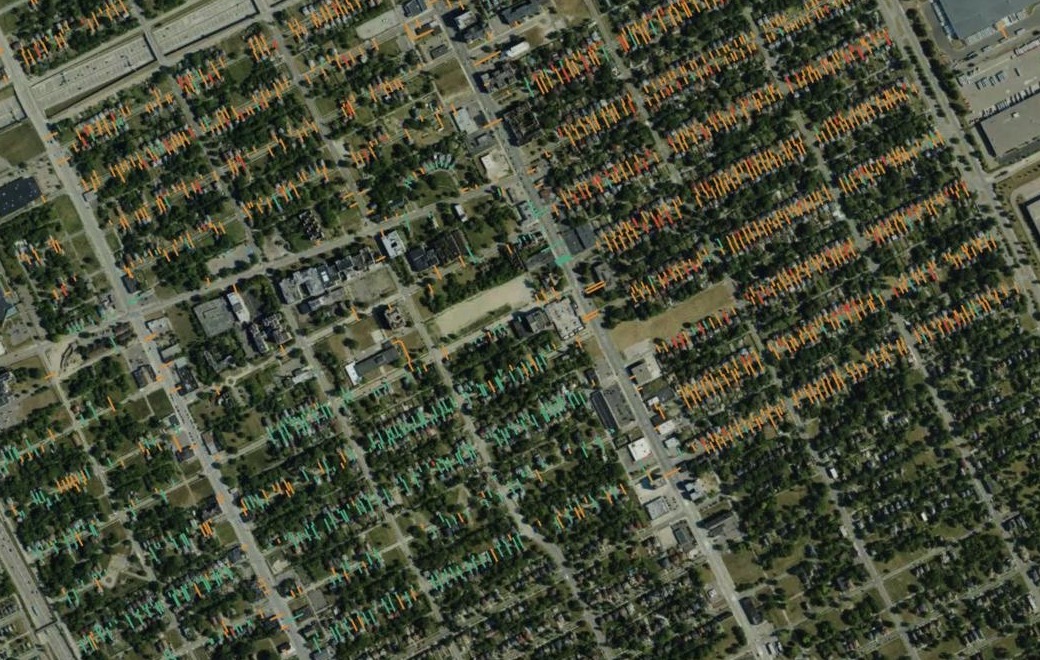
| Lead status | Service lines |
|---|---|
| Presumed lead | 2,535 |
| Known lead | 292 |
| Non-lead or already replaced | 686 |
Of 3,513 lines. Residents find their own by searching the address.
For whoever answers for the lead lines
The inventory exists.Residents want to know about their own line.
The state wants the numbers.
Under the federal Lead and Copper Rule Revisions, water systems keep an inventory of their service lines, the pipes from the water main into each building, and make it public.
Here you attach the file you already publish. Mapstack makes the map residents search and the counts the state asks for, and reads the file closely enough to say where it would mislead.
One real inventory
Every service line in Highland Park, counted for the state
The City of Highland Park, Michigan, published its inventory in October 2024 for the state and federal lead rules: each line from the main to the house, with its materials, its status and its replacement dates.
- Lead or presumed lead
- 80.5%of the lines, all marked as needing replacement
- Checked in the field
- 282of the known lead lines; the rest are known from other records
- Kept out
- 210inspection dates sitting in the replacement-date columns
| Lead status | Share of lines |
|---|---|
| Presumed lead | 72.2% |
| Non-lead or already replaced | 19.5% |
| Known lead | 8.3% |
It checks the dates before it counts them.
Asked for the lines replaced each year, Mapstack found 210 lines still marked as needing replacement with dates from a 2023 inspection project in the replacement-date columns. Counted as they stood, they would have passed for replacements and overstated progress. It kept them out, showed them apart as inspections, and said why.
City of Highland Park, Michigan, Service Line Inventory, October 2024, from the Detroit Data portal. Run on 15 November 2026.
From the inventory you publish to a map and a count
Columns: Address (the building it serves), Material (lead, copper and others), Federal class (lead or not), Status (to replace or not), Replaced (a date for each side), Project (the scheme). 3,513 rows. Here each line comes drawn from the main to the house. A list of addresses works too: each is found and placed.
What you get
- A map of every line, coloured by lead status, for residents to search.
- A count of each group, with the rule used for each.
- Replacements by year, from the file’s own dates, with inspections kept apart.
- What would throw the counts off, from spellings that differ to columns left empty.
Write it up for residents and the state at once
One more request turns the findings into a report.
It closes with a line for both readers: a service-line classification is not a tap-water test result.
Make that into a short report we can publish for residents and attach to our submission to the state: the map, the counts for each group, a chart of lead lines replaced each year, how you counted, and the caveats about the data.
A report with the map, the table of the three groups, a chart of replacements by year with the inspections shown apart, the method and the caveats, ready to publish or to download as a PDF or Word document.
How it goes
You bring the inventory. Mapstack makes the map and the count.
Attach the inventory and say who the map is for.
Mapstack maps every line and counts each group.
You get how each group was counted.
Common questions
What happens to our inventory?
It stays in your workspace. Only people with a seat in your workspace can see it. Nothing leaves unless you publish it yourself.
It is not used to train AI. Your data and your conversations are not used to train AI models.
It is still yours. You keep ownership of what you bring in. Delete it and it is removed.
The full answer is in the documentation: Your data, privacy and security.
What does it cost?
Free to start. One seat, for you, with a starter amount of work each month. No card.
The map, the counts and the checks are on the free seat. With your own files and public sharing.
The written report is on a paid seat. Paid seats are per person, and bring more work each month.
The prices are on the pricing page.
What can residents do with the map?
Find their own line. Search by street address and the map goes to it.
See what it is made of. The pop-up gives the material on the city side and the home side, and whether it needs replacing.
Open it from one link. Publish the map and share the link.
Map yours.
Free to start. Reports on a paid seat.