

Re-run last month's analysis on this month's figures
Do a monthly analysis once, then hand Mapstack the next month’s file and get the same method, a new map and what changed.
Best for
Anyone who reports the same figures every month, quarter or year: community safety and police analysts, performance teams, consultants with a standing client report. You end up with this month's result made the same way as last month's, side by side with it, and the areas that moved most named.
The example in this guide is real public data: two months of street-level crime from police.uk for the area around Cardiff, August 2026 (4,563 records) and September 2026 (4,013 records). Each record has a crime type, a month, a position snapped to a nearby street and the last outcome. Every ask below was sent with those files, in one session: August first, September when it came in. Results vary in the detail from one run to the next.
What you need
- This month's file, in the same shape as last month's: the same columns with the same names.
- Last month's work, in a session you can go back to, or the method written down.
- For a routine, which runs it without you: a Creator or Creator Max seat on a workspace that pays for its seats.
Before you start
- State the method in full the first time. Which records, which areas, which population, what rate. A method that was stated can be repeated exactly; one Mapstack chose for you is repeated as it chose, which you may not have noticed.
- Use the same session for the next month. Mapstack repeats what it did in that session. Started from a new one, say the method again in full.
The prompt
This is August's police.uk street crime for the Cardiff area. Count anti-social behaviour by Cardiff electoral ward, work out the rate per 1,000 residents with the latest population, and give me a map and a top-ten table. Leave out anything outside Cardiff.
What to expect
The first month is done, with each step kept
Mapstack keeps your file as a dataset, fetches what it needs and works through the method, keeping each step as a dataset you can open: in the example, the crimes, the population of Cardiff's 28 electoral wards from Census 2021, and the wards with their counts and rates. You get a choropleth map of the rate, a top-ten table and a chart ranking every ward. In the example Butetown came top in August, with 62 incidents and 5.11 per 1,000 residents.
Check the first month carefully: everything after copies it. Look at which population it used and what it left out.
Next month, you attach the new file and ask for the same again
Say it should be done the same way, and ask what changed; the ask is under Make it your own. Mapstack runs the same steps on the new file, reuses the areas and population from last time, and compares the two months ward by ward: each ward's new rate, last month's, the change and the change in rank. It names the biggest movers. In the example Butetown rose from 5.11 to 6.27 per 1,000 and stayed first; Pontprennau and Old St Mellons fell most, from 2.73 to 1.28, dropping from third to tenth.
Last month's map and datasets are left as they were. The new month gets its own map and a dataset that holds both months, so you can open either.
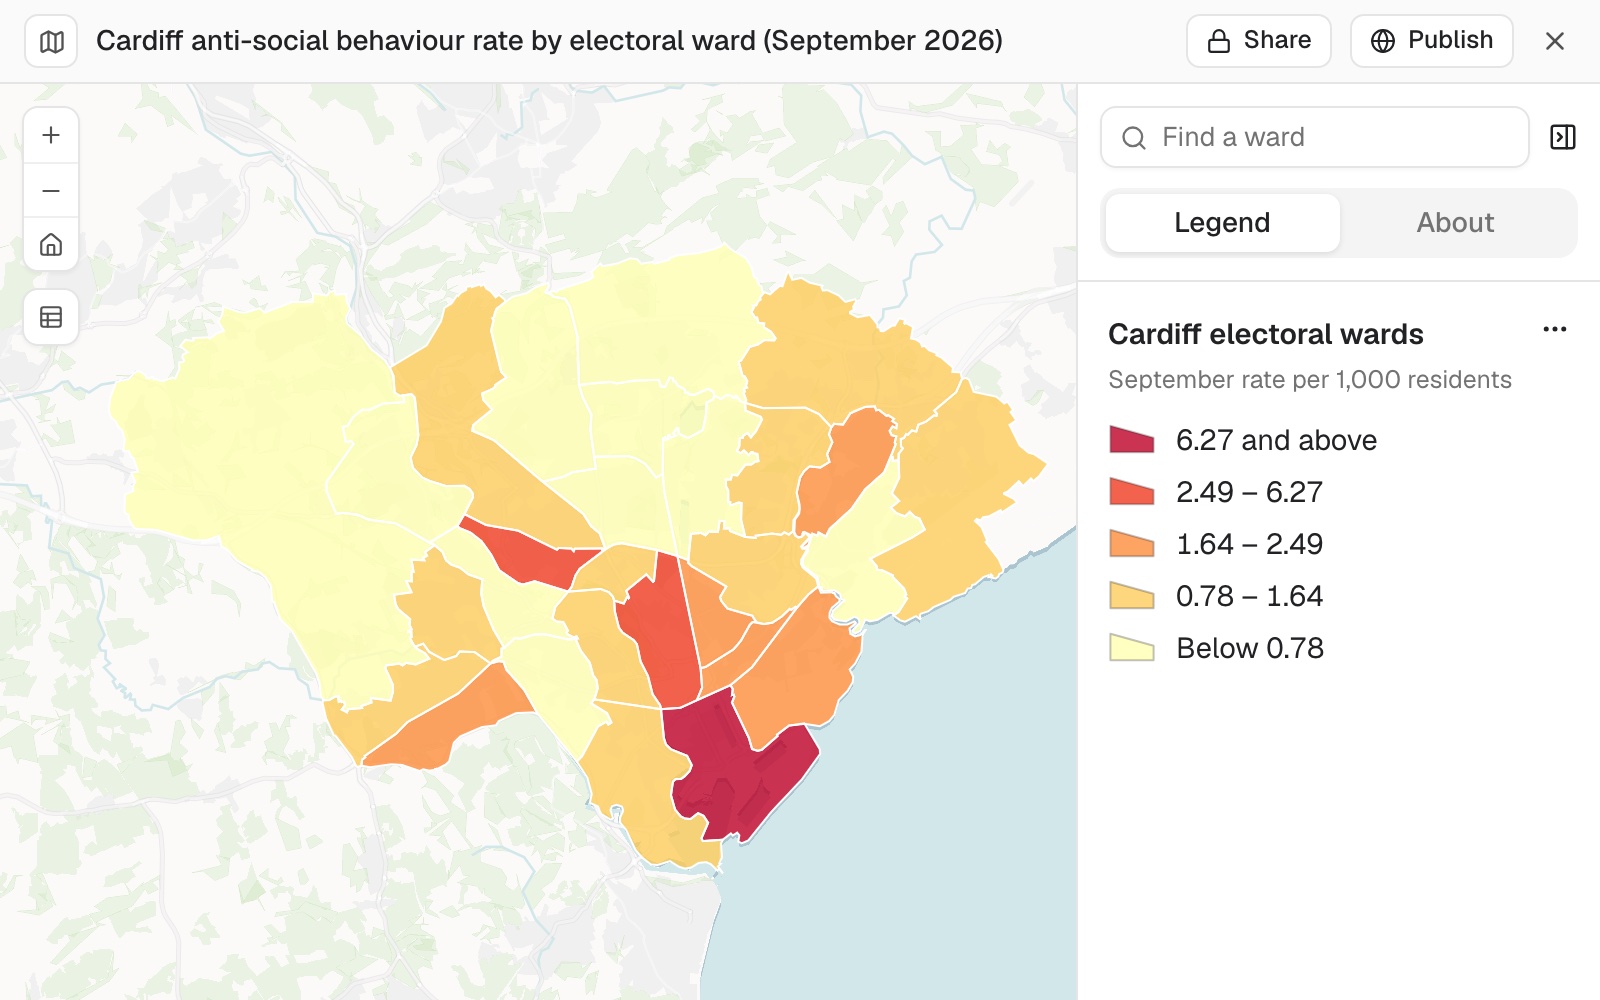 Example: September's rate of anti-social behaviour per 1,000 residents by Cardiff electoral ward. Butetown, at 6.27, is in the top class on its own.
You check the comparison before you report it
Read the change column against the counts. Small numbers swing: a ward going from 32 incidents to 15 halves its rate. Compare the class breaks in the two legends too. Unless you ask for fixed classes, each month's map gets breaks worked out from its own figures, so the same colour can mean different rates in different months: in the example the top class started at 4.2 per 1,000 in August and at 6.27 in September.
Make it your own
September's figures are in. Do exactly what you did last time with the new month, same method, and tell me which wards moved most.
Common questions
Can I compare the two months' maps by colour?
Only if they share class breaks. Unless you say them, each month's classes are worked out from its own figures, so the same colour can mean different rates. Ask for fixed breaks and state them, so every month uses the same ones.
What if I start next month in a new session?
Say the method again in full, step by step: which records, which areas, which population, what rate. Mapstack repeats what it did within one session; a new session starts from what you say.
What if this month's file has different columns?
Check the column names and their order against last month's file, and make them match. A file in a different shape may be refused, or give results that cannot be compared.
Why did one area's rate move so much?
Small numbers swing: a ward going from 32 incidents to 15 halves its rate. Read the change column against the counts before you report a mover.
Can it run every month without me?
A routine repeats a brief of the work and updates its datasets and maps, but there is no monthly schedule. Use Run now each month, run it weekly, have another system start it, or have it run after a dataset is edited. See When a routine runs.