

Find where incidents cluster: a hot spot map
Turn a list of incidents into a map of statistically significant hot and cold spots, on a rate per household, with the method written down.
Best for
Crime and community safety analysts, fire and public health teams, and anyone asked "where are the problem areas?" who has a list of incidents. You end up with a map that separates real clusters from the ordinary unevenness of the data, the method stated so it can go in a briefing, and the incidents on top.
The example in this guide is real public data: one month (September 2026) of street-level crime from police.uk, 16,962 records for Leeds and the area around it, each with a crime type, a street location, coordinates and an outcome. police.uk moves each crime to a nearby point on a street to protect privacy, so the points are approximate. Every ask below was sent with that file, and results vary in the detail from one run to the next.
What you need
- The incidents, as a spreadsheet with coordinates or addresses, or a GIS file. Other kinds of record can be in the same file: say which to keep.
- The areas to test, if you have your own. Otherwise name official ones (LSOAs, census tracts) and Mapstack fetches them, and the population or household figures for a rate.
- A Free, Creator or Creator Max seat.
Before you start
- Make sure the file covers the whole area. Areas with no records because the extract stopped short look like areas with no incidents, and come out as cold spots.
- Ask for a rate. Counts mostly find where people live. Per household or per head finds where the risk is higher.
- The test needs enough areas. At least 30; one city's small areas are plenty.
The prompt
Attached is one month (September 2026) of street-level crime from police.uk for Leeds and the area around it. Where are the burglary hot spots? Keep only burglaries inside the Leeds district boundary, run a hot spot analysis (Getis-Ord Gi*) on burglaries per 1,000 households by LSOA using Census 2021 households, and tell me the method, how many areas came out as significant hot and cold spots, and at what confidence.
What to expect
Mapstack keeps the records you asked for
It filters to the crime type, fetches the boundary you named and keeps the records inside it. In the example, 508 burglaries fell inside the Leeds district.
It works out the rate for each area
Mapstack fetches the areas and the census figures, counts the incidents in each area and divides. In the example: Leeds's 488 LSOAs (small census areas of roughly 1,000 to 3,000 people), each with its Census 2021 household count and burglaries per 1,000 households.
It tests every area against its neighbours
A hot spot analysis (Getis-Ord Gi*) asks whether an area and its neighbours together have higher values than chance would explain. Mapstack chooses how far "neighbours" reaches from the data itself, at the distance where the clustering is strongest, and corrects for testing hundreds of areas at once (a false discovery rate correction), so fewer areas come out significant by luck.
It reports all of this. In the example: neighbours within 2,911 m, 105 significant hot spots (75 at 99% confidence, 18 at 95%, 12 at 90%), 2 cold spots at 90%, and 381 areas not significant, with the ten strongest hot spots listed.
You read the result for what it says
A hot spot is a cluster, not a single bad street. An area with no burglaries at all can be a hot spot when its neighbours have high rates, and Mapstack says so when it happens; in the example, three of the ten strongest had none. For patrol or prevention planning that is the point: the cluster is the unit. If you need the areas with the highest rates themselves, ask for them ranked.
You map it
Yes, map the hot and cold spots by confidence level, hot in reds and cold in blues, not significant in light grey, with the burglary points on top. How many burglaries were kept inside Leeds?
Each area's popup gives its household count, burglaries, rate, z-score and p-value; each point gives its street, crime ID and outcome.
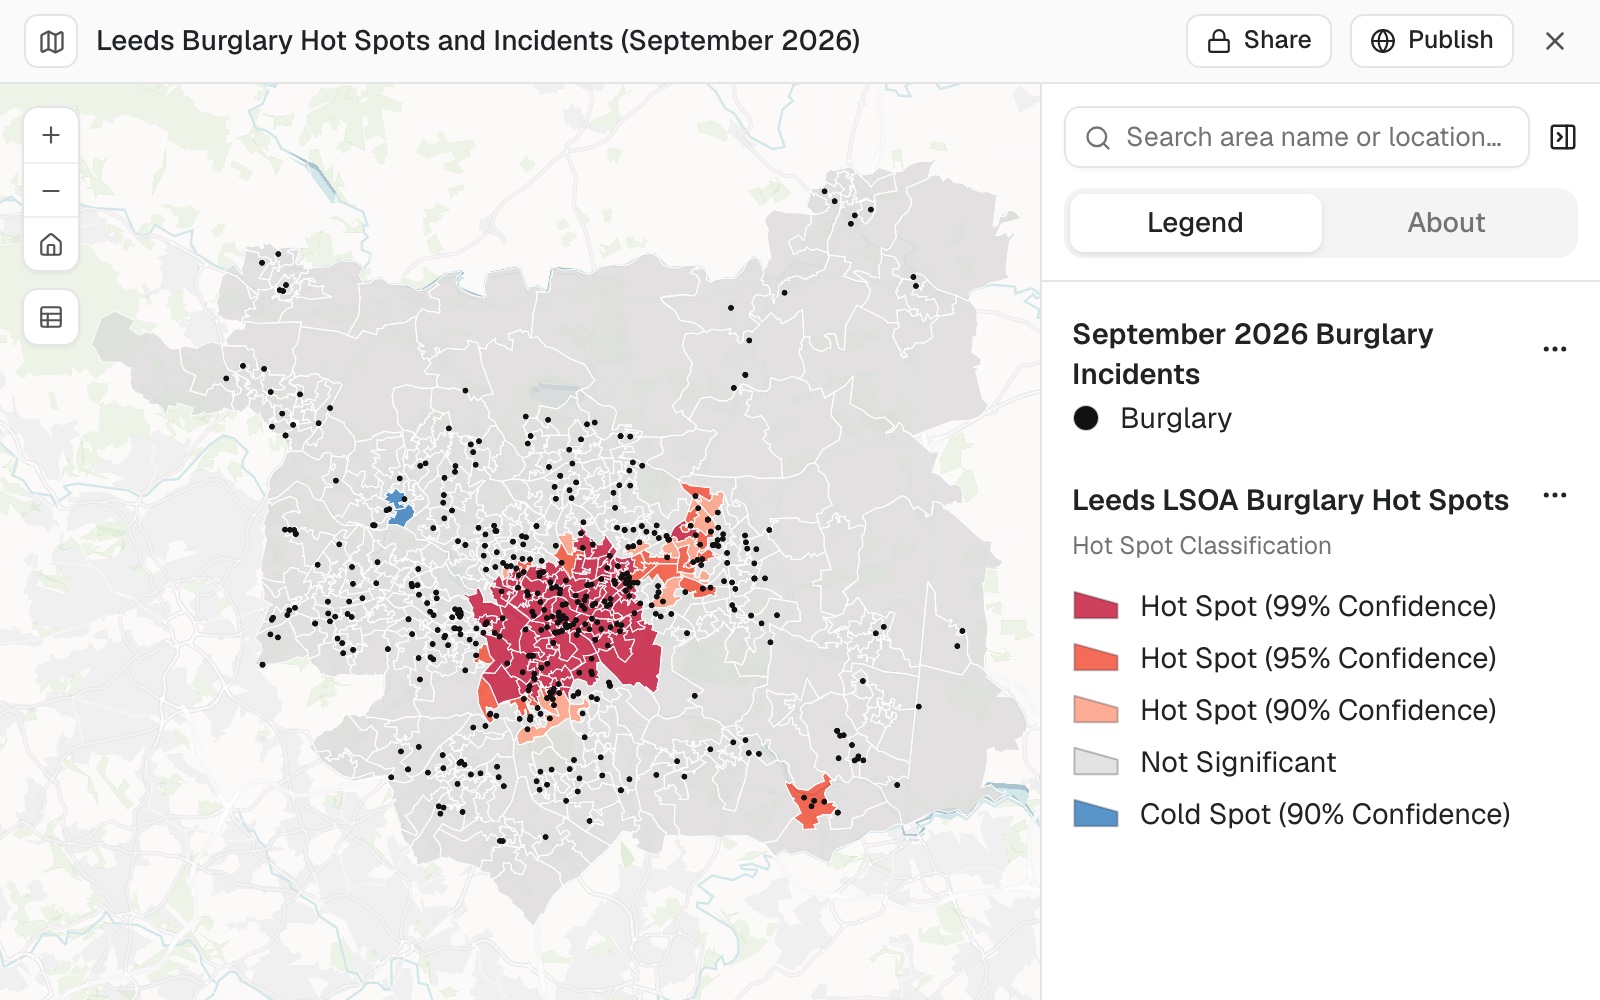 Example: burglary hot and cold spots across Leeds's 488 LSOAs, September 2026, by confidence level, with the 508 burglaries as small black points.
Make it your own
Make the burglary points small and black so they don't hide the hot spots or look like cold spots.
Common questions
Should I use counts or a rate?
A rate. Counts mostly find where people live; a rate per household or per head finds where the risk is higher. Name what to divide by, for example "burglaries per 1,000 households by LSOA using Census 2021 households".
Why are there cold spots along the edge of my area?
Usually because the incident file stops short of that edge: areas with no records look like areas with no incidents. Check the file covers the whole area before you read the cold spots.
Why is an area with no incidents a hot spot?
A hot spot is a cluster: an area and its neighbours together have higher values than chance would explain, so an area with none can sit inside one. If you need the areas with the highest rates themselves, ask for them ranked.
Can I compare one month with another?
Yes, if you fix the neighbour distance. Mapstack works it out from the data, so it moves when the data does: name one and keep it, for example "use neighbours within 2,911 m".
How many areas do I need?
At least 30. With fewer, use smaller areas or a wider place; one city's small areas are plenty. See Find hot spots and cold spots.