

Map how much of the population each fire station reaches in time, and what closing one would cost
Draw a drive-time area around every station, count the residents inside and outside, test a station closure, and write it up for a standards of cover document.
Best for
Fire and EMS planners, chiefs and the consultants who work for them: anyone who has to show how much of a city its stations reach within a travel-time target, and what a closure or a move would change. You end up with a coverage map, the share of residents inside and outside the target, a before-and-after for a station closure, and a written report with the method and the road-speed assumption stated.
The example in this guide uses only data Mapstack found itself, with nothing attached: the City and County of Denver's open data layer of Denver Fire Department stations (41 records, including the airport stations and three stations in Englewood, which Denver Fire serves by contract), 2020 US Census population by block for Denver (10,149 blocks), and 4-minute drive-time areas on OpenStreetMap roads. Incident history, the job's other usual input, is not public at point level for Denver, so it is left out; with your own, attach the file and ask for incidents covered the same way as residents.
What you need
- Your stations, as a spreadsheet with addresses or coordinates, or a GIS file. If your city or county publishes them, Mapstack can find them, as in the example.
- Your travel-time target, in minutes.
- A Creator or Creator Max seat for the report. The drive-time areas, the counts and the map work on any seat.
Before you start
- The areas use ordinary road speeds. They follow OpenStreetMap roads with no traffic, no sirens and no signal priority. Read them as a cautious estimate of where an engine can get, not as your service's own run times.
- Say whose population counts. Mapstack counts the residents of the area you name. Stations that serve a neighbouring town by contract will look as if they cover almost nobody.
- Large analyses are confirmed first. Before a long routing run, Mapstack tells you what share of your allowance it will use and waits for you to go ahead.
The prompt
Find the Denver Fire Department stations in the City and County of Denver and draw the area each one can reach within a 4-minute drive. What share of Denver's population is within 4 minutes of a station?
What to expect
Mapstack finds the stations and the population
It looks for an official list of stations first and keeps it as a dataset you can open. In the example it took the 41 stations from Denver's open data service, then fetched the 2020 Census population for every block in the city.
You get the share of residents within the target
Mapstack draws a drive-time area (an isochrone) around each station, merges the overlapping ones into a single footprint so nobody is counted twice, and counts the residents inside. Where a census block is cut by the edge of the footprint, it counts the share of the block's area that falls inside, which assumes people are spread evenly across the block. In the example: 487,300 of Denver's 715,522 residents, 68.1%, within a 4-minute drive of a station.
You see who is left out
Map the parts of Denver that no station reaches in 4 minutes, and how many people live there.
The unreached blocks become a dataset and a layer on the map, shaded by how many people live outside the target in each. In the example: 228,222 residents (31.9%) in 3,434 blocks or parts of blocks. Select a block on the map to see its population and how much of it lies outside.
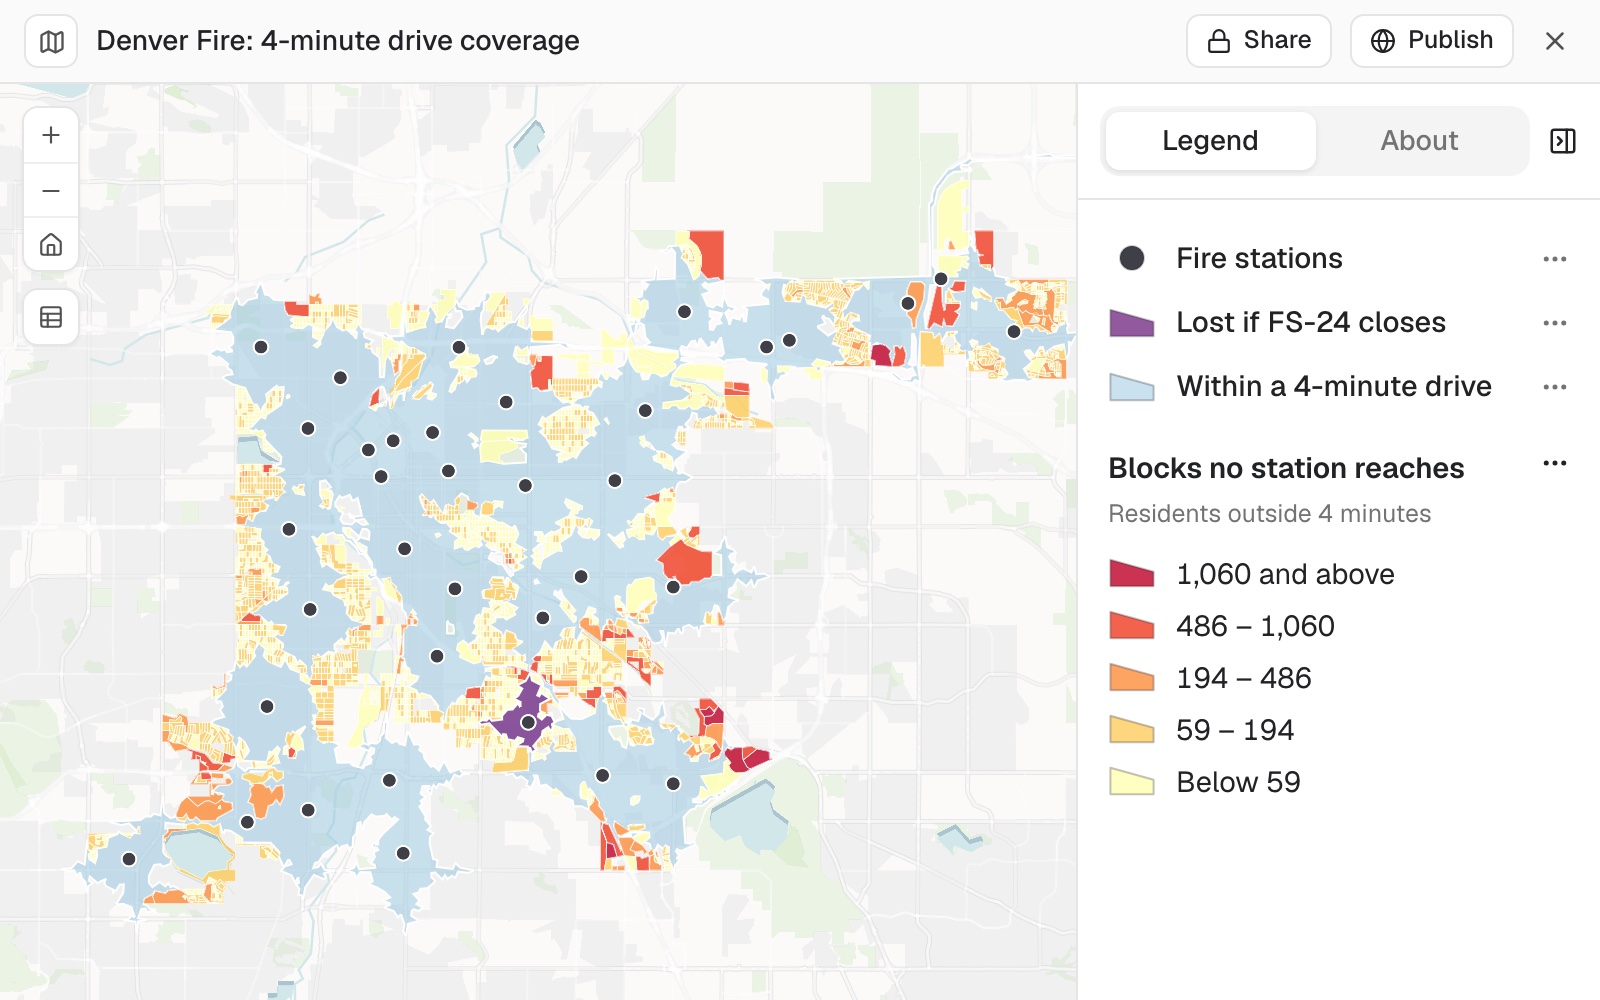 Example: Denver's 4-minute drive-time areas in light blue, the blocks no station reaches shaded yellow to red by the residents outside, and in purple the area only station FS-24 reaches.
You test a closure
Say which stations the question is about. Stations that serve a neighbouring town by contract, or an airport, reach few of your residents, so they would top any list of the least used:
Leave out FS-36, FS-37 and FS-38 in Englewood, which Denver Fire covers by contract, and the airport stations. Which station inside the city covers the fewest people, and what do we lose if it closes? Show the before and after.
Mapstack works out each station's population two ways: everyone inside its area, and the people only that station reaches. The second is what a closure loses, because anyone also inside a neighbour's area stays covered. It gives a before-and-after table and adds the lost area to the map.
In the example it set out both readings of "fewest". FS-6, downtown, has 37,657 residents within 4 minutes, but its neighbours reach all but 287 of them. FS-24, at 2695 S Colorado Blvd, has the fewest in its area, 4,722, and 4,578 of them are reached by no other station. Closing FS-24 leaves those 4,578 residents outside 4 minutes, and coverage drops from 68.1% to 67.5%.
You write it up for the standards of cover
Write it up as a short report for the standards of cover document, with the method and the road-speed assumption stated.
The report gives the baseline coverage and the closure scenario as tables, the counting method, and the routing assumption: OpenStreetMap roads at ordinary speeds, with no traffic, sirens or signal priority, and drive time only, not call handling or turnout. It says what the figures do not show: unit availability, simultaneous calls, or real response times. In the example it also flags a station record in the data with no station number, at 12025 E 45th Ave. Open it from the session or your Library; Download gives it as Word or PDF.
Make it your own
On the coverage map, show the 4-minute areas in one light blue with no classes, shade the unreached blocks from yellow to red by the residents outside, and show FS-24's lost area in purple so the three read apart.
Common questions
Do the drive times allow for sirens and traffic?
No. They follow OpenStreetMap roads at ordinary speeds, with no traffic, sirens or signal priority, so read them as a cautious estimate of where an engine can get. If your service has its own run times, compare them with the map before you rely on it.
What about stations that serve a neighbouring town?
They cover few residents of the area you named, so they look almost idle. Say which to leave out, for example "Leave the Englewood and airport stations out", and ask again.
Can I include our incident history?
Yes. Attach the file and ask for incidents covered the same way as residents.
How do I check the figures?
Ask where a figure came from, and when two answers give different figures for the same thing, ask which is right and why. A count of whole blocks touched by an area is higher than a count of the share of each block inside it, so ask for one method throughout.