

Join your table to area boundaries and map it
Put a table keyed by area code onto the matching boundaries, see how many rows matched on each side, and map the result.
Best for
Anyone with figures for areas in a spreadsheet and no shapes to go with them: an official statistics table, survey results by ward, sales by postcode district. You end up with one dataset carrying your columns on the boundaries, a count of what matched and what did not, and a map.
The example in this guide is a real official table: the English Indices of Deprivation 2025 from the Ministry of Housing, Communities and Local Government (File 7), cut to Liverpool's 302 LSOAs (small census areas). Each row has the 2021 LSOA code and name, the local authority, the Index of Multiple Deprivation (IMD) score, rank and decile, and the income and employment scores and deciles. It has no shapes. Every ask below was sent with that file; the boundaries were fetched by Mapstack. Results vary in the detail from one run to the next.
What you need
- Your table (.csv, .xlsx or .xls), with one column that identifies the area: a code is best, a name works.
- The boundaries. Name them (the geography and the year, such as Census 2021 LSOAs) and Mapstack fetches official ones, or attach your own as a GIS file.
- A Free, Creator or Creator Max seat.
Before you start
- Codes beat names. Names are spelled in more than one way; codes are not. Name the code column if there is more than one.
- Match the year of the geography. Area codes change when boundaries are redrawn. A table on 2021 areas needs 2021 boundaries, or some rows will not match.
- Ask for the match counts. They are the check that the join worked.
The prompt
Attached is the English Indices of Deprivation 2025 table for Liverpool's LSOAs (MHCLG File 7, cut to Liverpool). Join it to the Census 2021 LSOA boundaries for Liverpool on the LSOA code, tell me how many rows matched and how many didn't on each side, and map the IMD decile with decile 1 (most deprived) darkest.
What to expect
Your table becomes a dataset, and Mapstack fetches the boundaries
The file is kept as a dataset you can open. Mapstack finds the boundaries you named and keeps them as a dataset too. They can cover more than you need: in the example it fetched the LSOAs for the whole Liverpool City Region, 1,003 areas.
It joins on the key and reports the match
An attribute join matches rows on a shared value, here the LSOA code in your table against the code on each boundary. The result is a new dataset: your columns on the shapes.
Asked, Mapstack gives the counts for each side and explains them. In the example, all 302 rows of the table matched a boundary, and 701 boundaries had no row; Mapstack named them as the surrounding boroughs (Knowsley, Sefton, St Helens, Wirral and Halton), outside the table's area.
You check the unmatched rows
Every row of your table should match. If some do not, read their codes: a different year of geography, leading zeros lost in a spreadsheet, or names spelled two ways. Unmatched boundaries are expected when the boundaries cover a wider area than your table, as in the example.
It makes the map, and you make it read right
Mapstack maps the column you named and adds popups with the rest of your columns, a legend and a chart of the values. A decile, a rank or a category needs one class per value. In the example the first legend showed ranges such as "1.5 – 2.5", so it was asked again:
The legend shows ranges like 1.5 - 2.5. Make it one class per decile, labelled 1 (most deprived 10% in England) to 10 (least deprived 10%), in reds rather than blues.
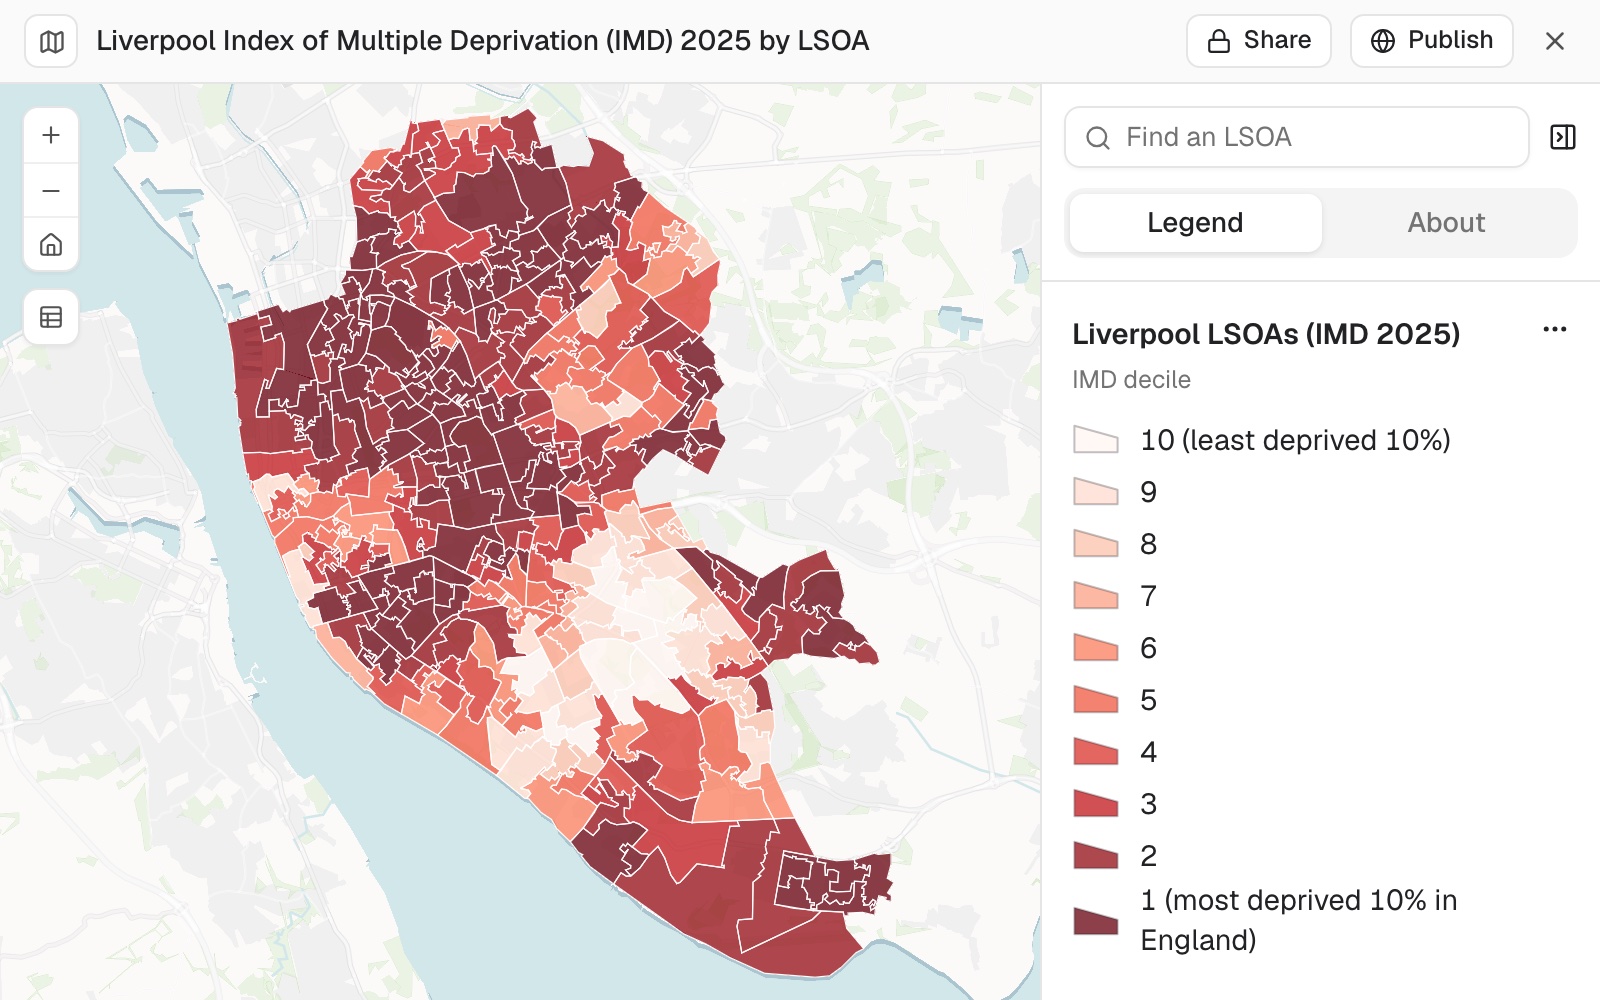 Example: Liverpool's 302 LSOAs by Index of Multiple Deprivation 2025 decile, from the joined table, one class per decile. 111 of them are in decile 1, the most deprived 10% in England.
You ask questions of the joined data
The joined dataset answers questions like any other. In the example, asked how many areas were in the most deprived decile (the ask is under Make it your own), Mapstack gave 111 of 302, 36.75%, with the count and share for every decile; the counts agree with the source table.
Make it your own
How many of Liverpool's LSOAs are in decile 1, and what share of the city's LSOAs is that?
Common questions
What if few or none of my rows match?
The codes are probably written differently on each side (case, spaces, leading zeros), or come from a different year of geography: a table on 2021 areas needs 2021 boundaries. Ask: "Show me a few codes from each side."
Why are so many boundaries unmatched?
Usually the boundaries cover a wider area than your table. In the example 701 of the 1,003 LSOAs fetched were in the boroughs around Liverpool. To show only your areas, ask: "Leave the unmatched boundaries off the map."
Can I join on area names instead of codes?
Yes, but names are spelled more than one way, so some rows may not match. Ask which rows did not match, then correct the names in your file or switch to a code column.
Can I have one colour for each decile?
Yes. Say it: "Make it one class per decile, labelled 1 (most deprived 10% in England) to 10 (least deprived 10%)." Left open, Mapstack chooses the classes itself, and for a whole-number value they can be ranges such as 1.5 – 2.5.
Can I use my own boundaries?
Yes. Attach them as a GIS file, and name the code column if there is more than one. Otherwise name the geography and the year, and Mapstack fetches official ones.