

Put a lidar point cloud on a map in its own colours, or by height or class
Upload a lidar survey and see it standing in 3D on an ordinary map, in the colours the survey recorded, by height or by class.
Best for
Anyone with a survey to show: a site, a building, a corridor. You end up with the point cloud as a scene in your Library, standing on a 3D map among the streets around it, in the colours the survey recorded or coloured by height or class.
The example in this guide is a real airborne lidar survey of Autzen Stadium in Eugene, Oregon, a public sample file from the PDAL project: a 2.7 MB LAZ file of 693,895 points in a UTM coordinate system, with a colour recorded for every point.
What you need
- A point cloud or 3D model: LAS, LAZ or E57, or a 3D format such as SLPK, 3TZ or IFC.
- A Creator or Creator Max seat. Scenes are on paid seats.
Before you start
- Large surveys take a while to convert. The scene is prepared in the background; you can carry on meanwhile.
- Scenes are for showing. Mapstack does not measure, classify or process the points.
The prompt
Airborne lidar of Autzen Stadium, Eugene, Oregon, in UTM. Put the point cloud on a map in 3D in the colours the survey recorded, then show it by height. Tell me the point count, the classes present and the CRS.
What to expect
The survey becomes a scene
Mapstack reads the coordinate system from the file (in the example, NAD83 / UTM zone 10N) and converts the survey into a scene in your Library. The conversion shows its progress and can be cancelled.
It stands on the map in the colours the survey recorded
When the scene is ready it stands on an ordinary map in 3D, among the streets and buildings around it. A survey that recorded colour opens in Photo colour, its own colours: in the example, the green pitch, the grey stands and the trees around the stadium. Point size and Detail set how solid the cloud looks.
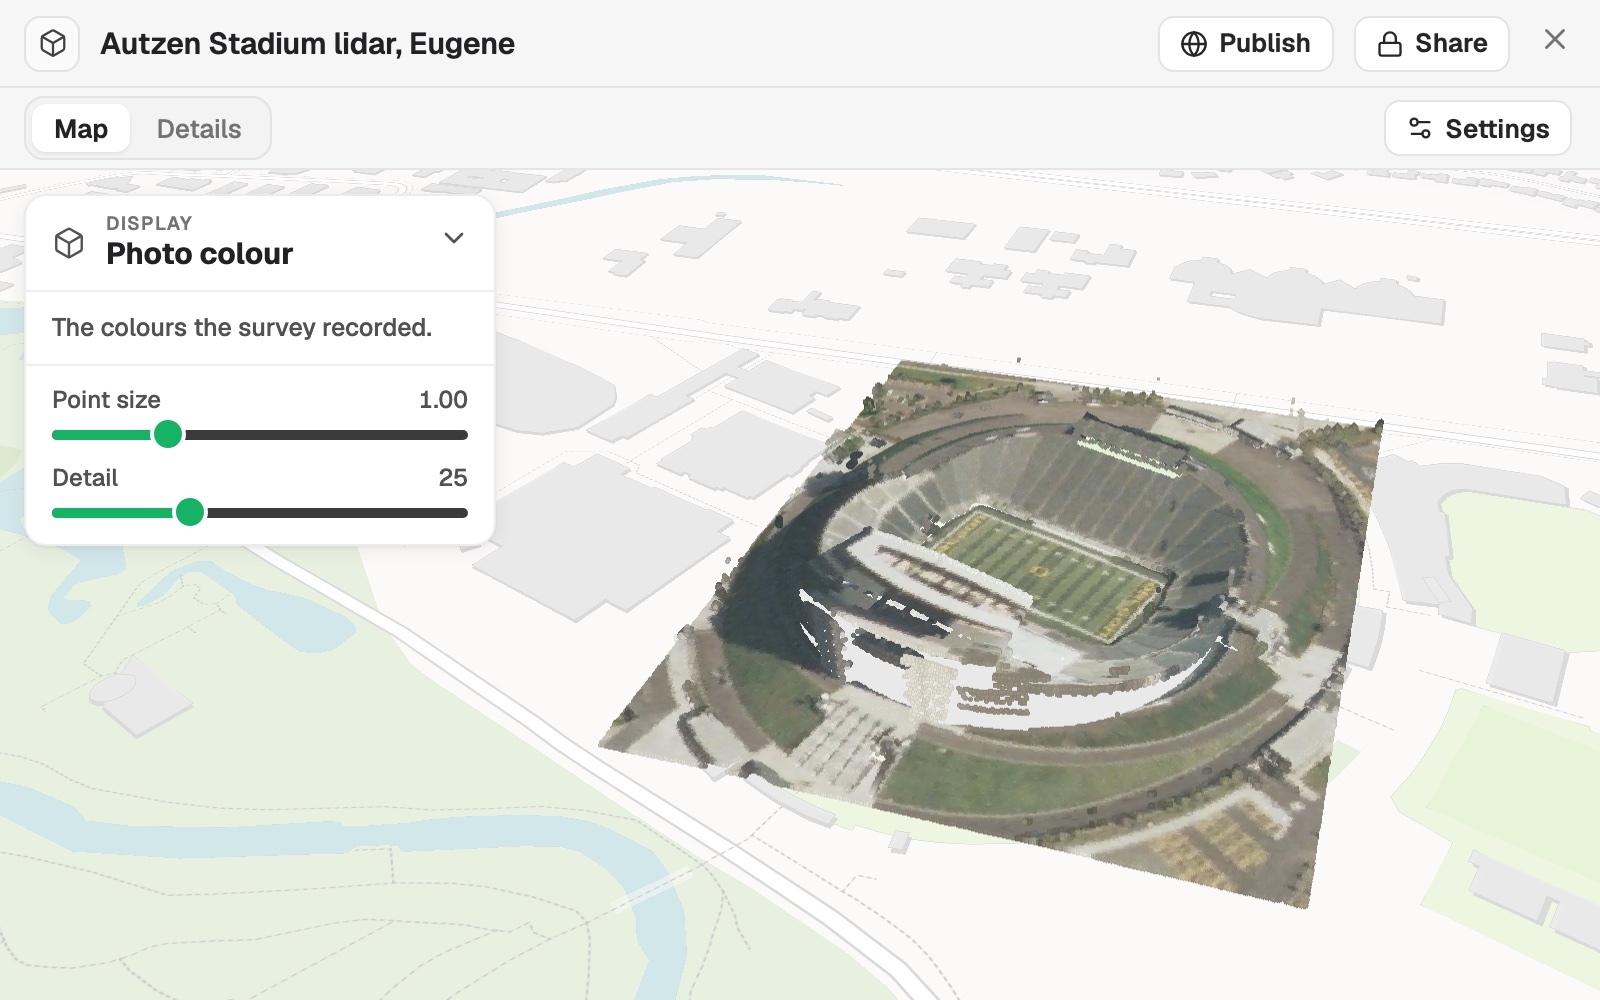 Example: the Autzen Stadium survey in 3D on the map, in the colours the survey recorded, with Display set to Photo colour.
Ask for a map and the scene goes on it as a layer beside your other data, in the same colours unless you name others.
You show it by height or by class
Open Display, or say it ("Now show it by height"). Height colours the points on a ramp from low to high. Class colours them by what each point was classified as, and lists the classes with their share of the points, each with a box to hide it: in the example, Unassigned 72% and Ground 28%.
The facts are on the scene
The scene's card in your Library gives its size and point count (in the example, 302 × 349 m and 693,895 points), and its Details tab carries the rest of its facts.
Common questions
Why is the map empty at first?
The scene is still being prepared. Large surveys take a while to convert, in the background, and you can carry on meanwhile. Ask again once the scene is ready.
Where does the coordinate system come from?
From the file, when it records one. If it records none, or not the right one, tell Mapstack which it is, for example "It is in NAD83 / UTM zone 10N."
Can I colour it by height, or hide some classes?
Yes. Under Display, Height colours it from low to high, and Class lists the classes with their share of the points, each with a box to hide it. Or ask: "Show it by height."
Why is there no Photo colour?
Photo colour is offered when the file carries colour that is real. If your survey recorded colour and the option is missing, open the scene's Settings and answer Is the colour real?
Can Mapstack measure or classify the points?
No. Scenes are for showing: Mapstack does not measure, classify or process the points.