33 free datasets tagged “residents”. Open any one in Mapstack — no GIS skills, no download.
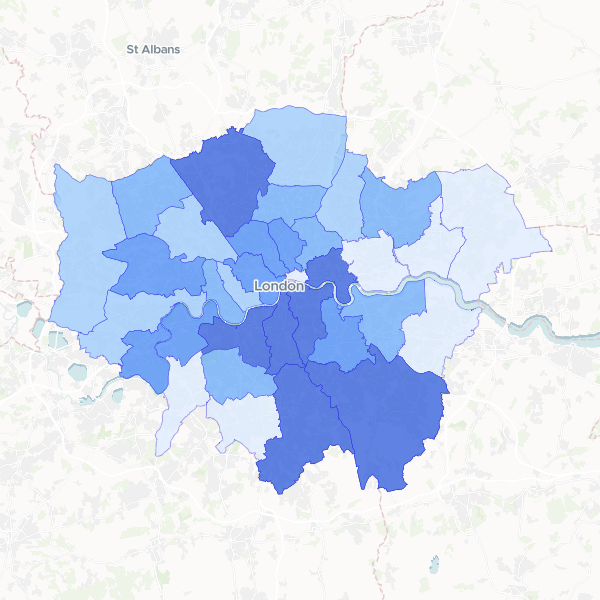
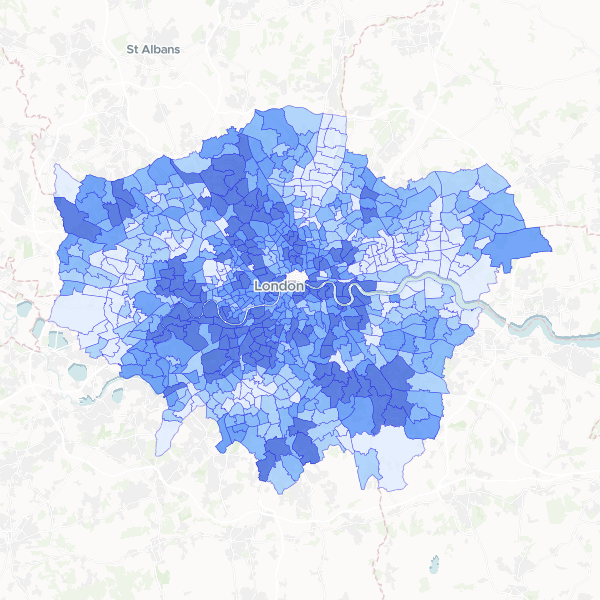
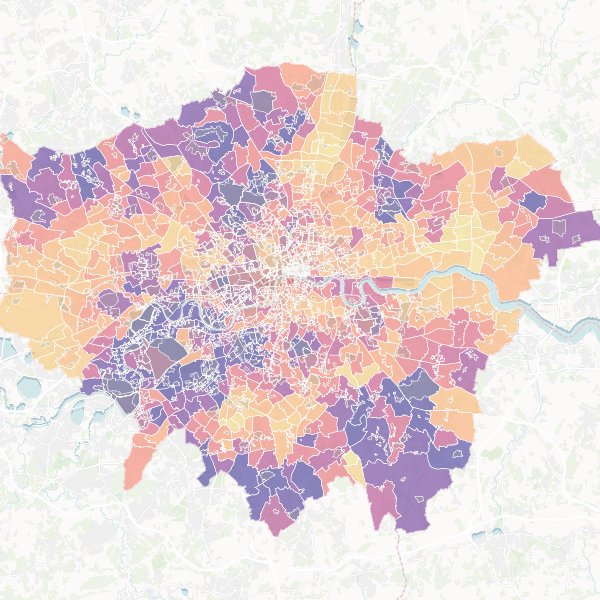
London residents in higher managerial or professional occupations by LAD
Share of usual residents aged 16+ in NS-SEC L1, L2 and L3 (higher managerial, administrative, and professional occupations) versus total residents aged 16+.
33 features
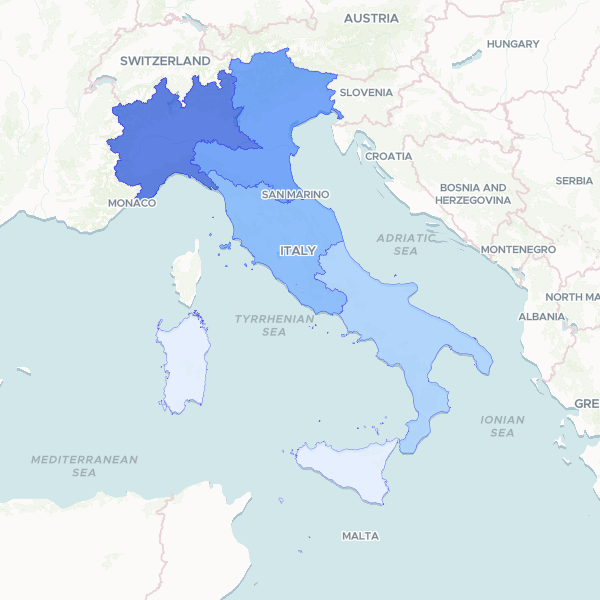
African Residents in Italy by Country of Citizenship (2021)
Resident foreign population from major African nations in Italy, 2021. Data is presented at the Ripartizioni geografiche (macro-regional) level. Other African nations are omitted from this dataset. The Total Resident Population is included as a denominator. Census-based sample estimates.
5 features
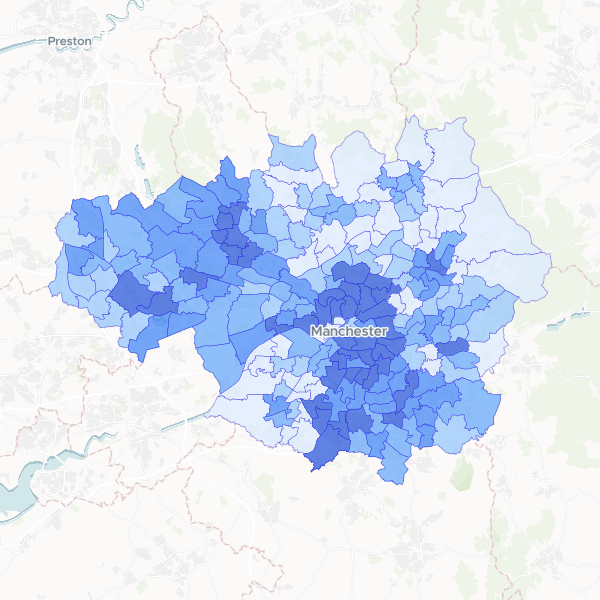
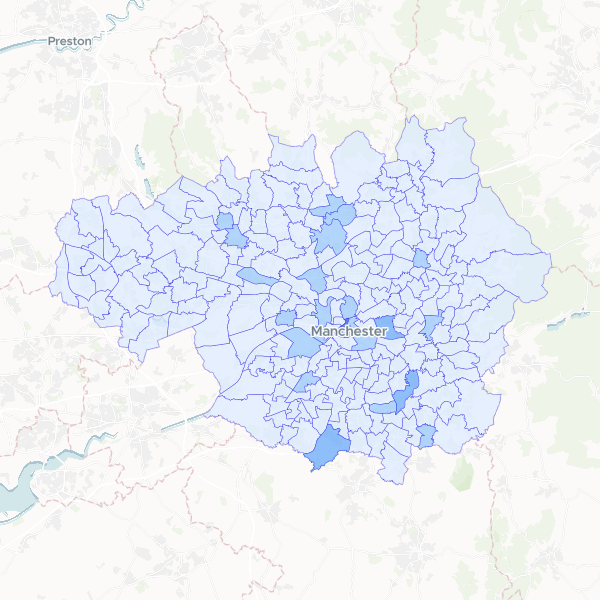
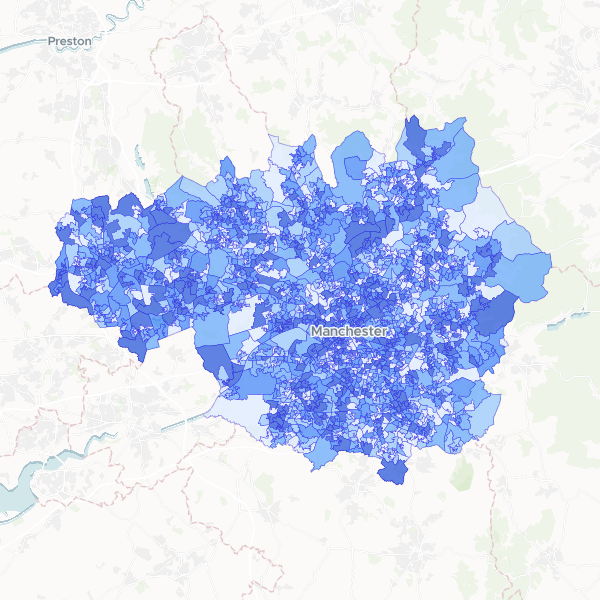
Greater Manchester population by ward
Total population (all usual residents) for wards in Greater Manchester.
215 features
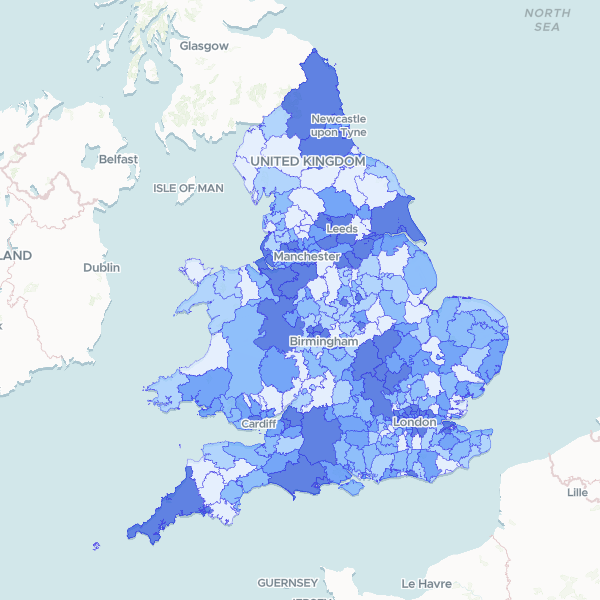
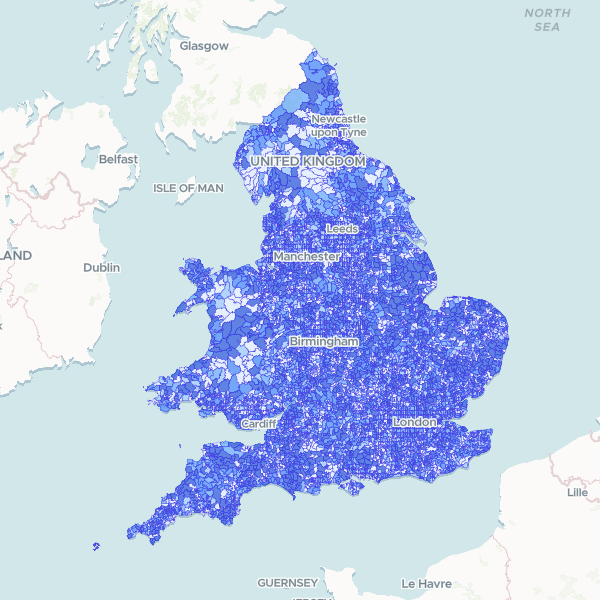
England and Wales Population by Local Authority
2021 Census full count of Total Usual Residents by local authority district.
331 features
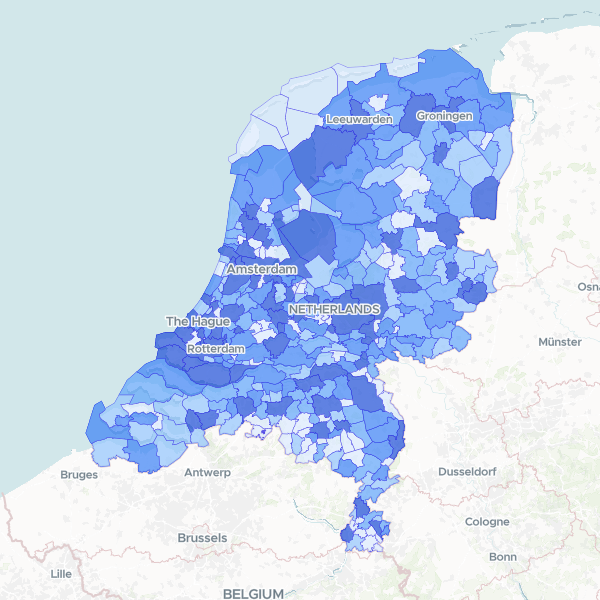
Netherlands Population by Municipality
Total population counts by municipality (gemeente) in the Netherlands, derived from the 2025 Kerncijfers wijken en buurten survey. Full count, approximate at sub-municipal levels but exact at gemeente level.
342 features
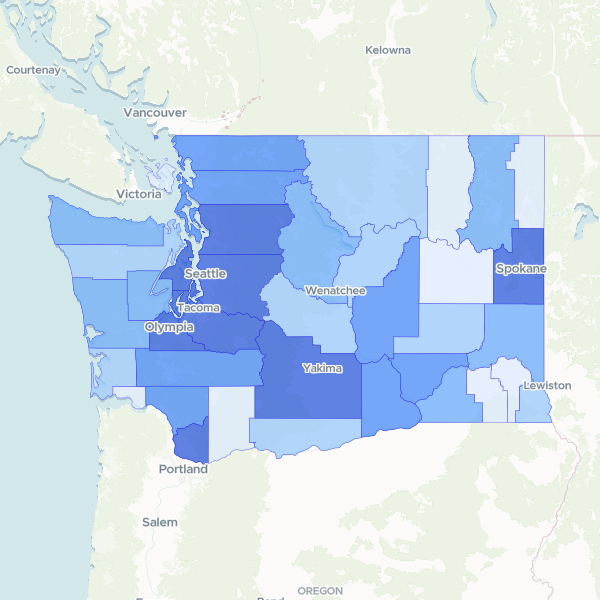
Washington Population by County
Total population count for each county in Washington state.
39 features
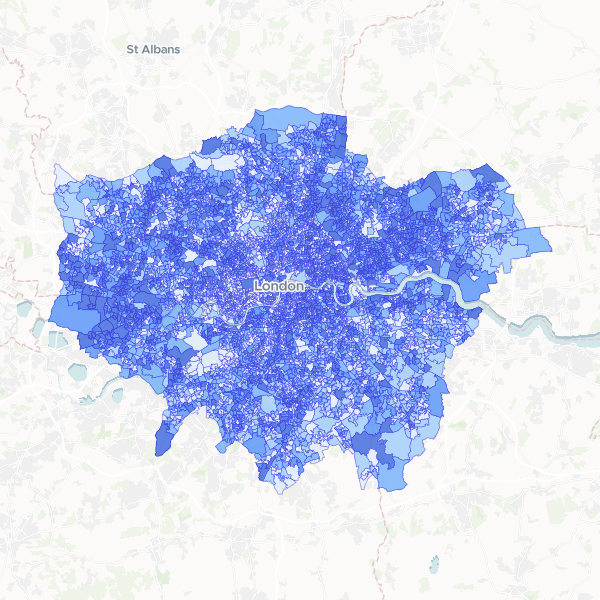
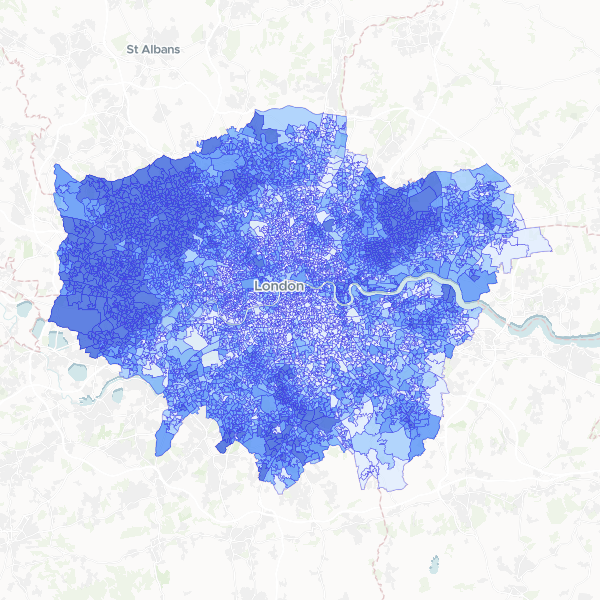
London Population by LSOA
Total usual residents at LSOA level in London.
4,995 features
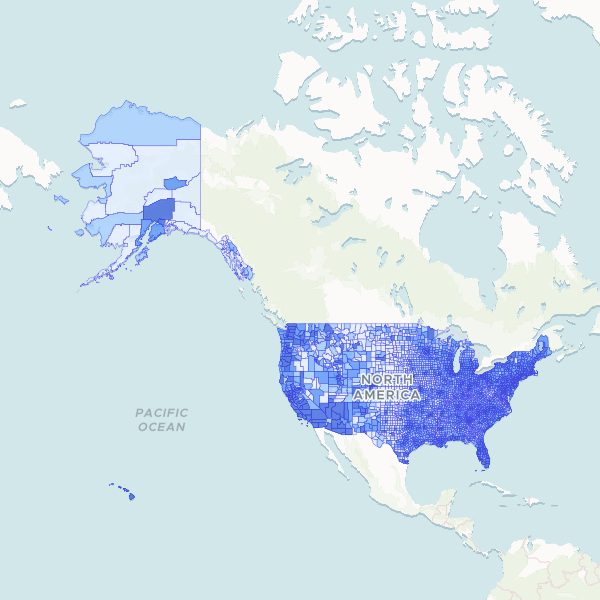
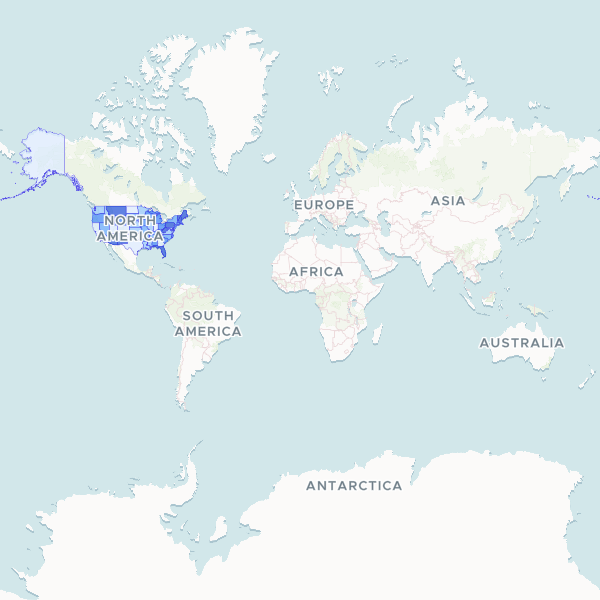
US population by county
Total population by county for the United States based on P1_001N.
3,143 features
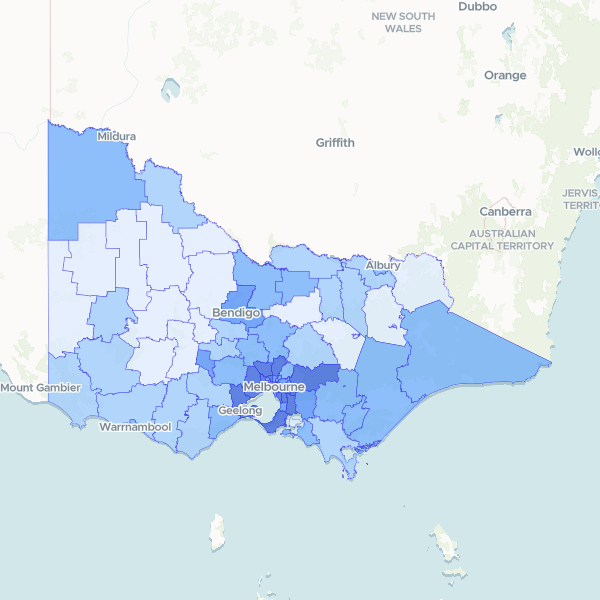
Victoria population by Local Government Area
2021 Census full-count population (Total Usual Residents) for Local Government Areas in Victoria, Australia.
80 features
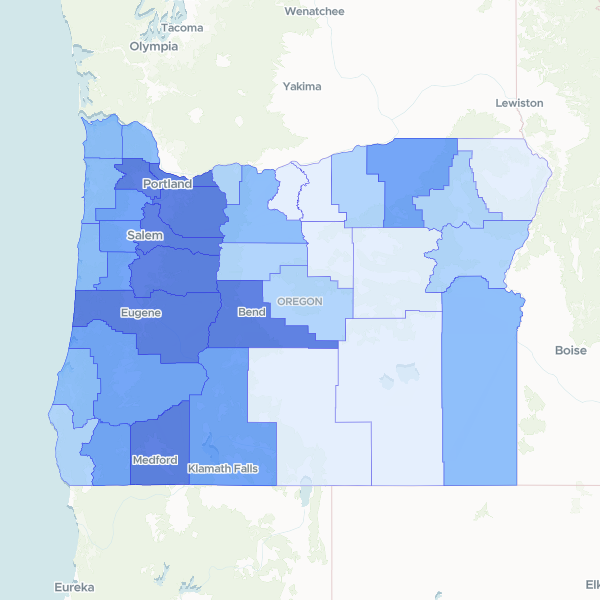
Oregon Population by County
Total population by county in Oregon.
36 features
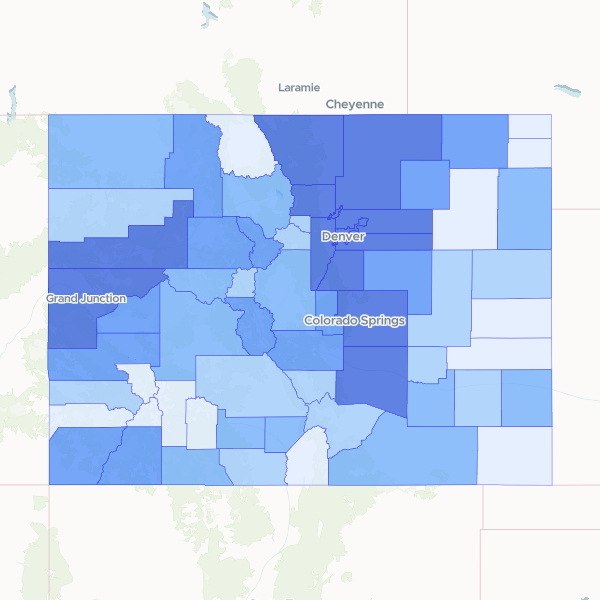
Colorado Population by County
Total population by county for Colorado, based on the 2023 5-year American Community Survey. Note: These are survey estimates, not a full count. Population density cannot be directly calculated from this dataset alone as it lacks land area in square miles. Household income is in 2023 inflation-adjusted dollars. Margin of error attributes are separate and excluded.
64 features
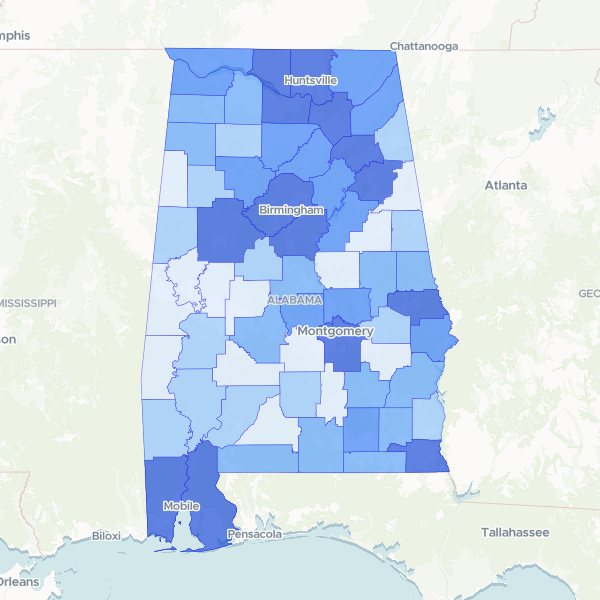
Alabama county population
2020 Census Total Population by Alabama county. This is a full count, subject to differential privacy. Normalise crime counts using this 'Total Population' column.
67 features
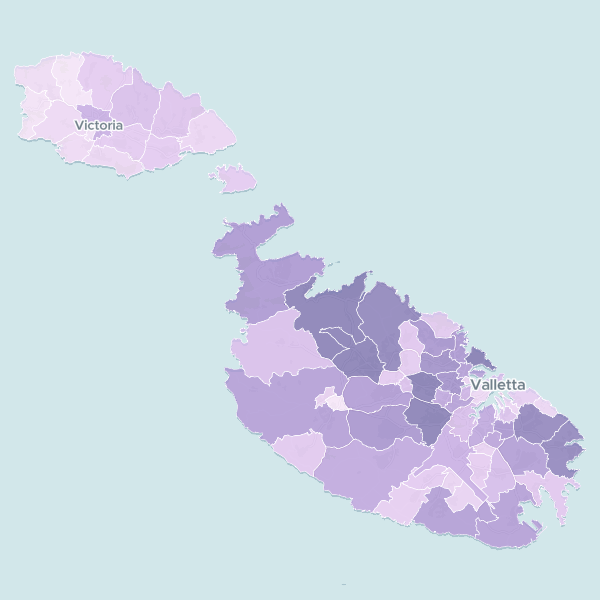
Malta Population by Local Council (2023)
Interactive map showing the official 2023 population estimates for Malta's 68 local councils, including growth trends since 2012.
Map
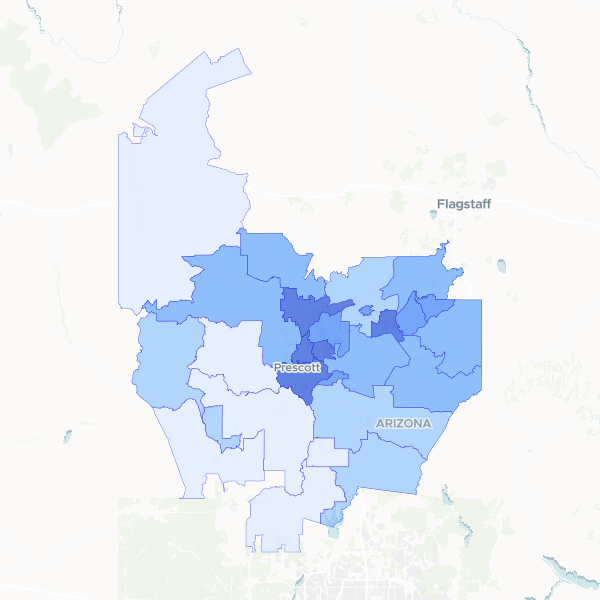
Yavapai County Population Density
A detailed look at population distribution across Yavapai County, Arizona, showing both total resident counts and density per square kilometer by ZIP code.
28 features
England and Wales population by LSOA
Census 2021 full-count population total by Lower layer Super Output Area (LSOA). Note: Coverage is restricted to England and Wales.
35,672 features
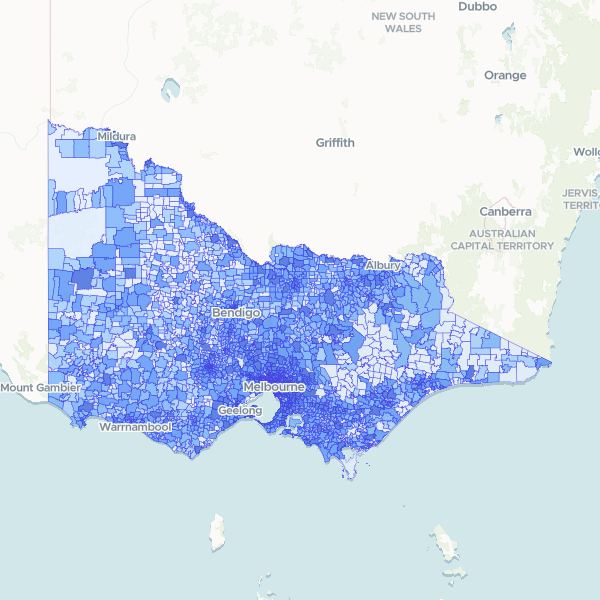
Victoria population by suburb by sex
Counts of usual residents by sex in suburbs (SAL) in Victoria, 2021 ABS Census General Community Profile (a full count). Use 'Total Usual Residents' (Tot_P_P) as the denominator to normalise these counts as rates or proportions.
2,944 features
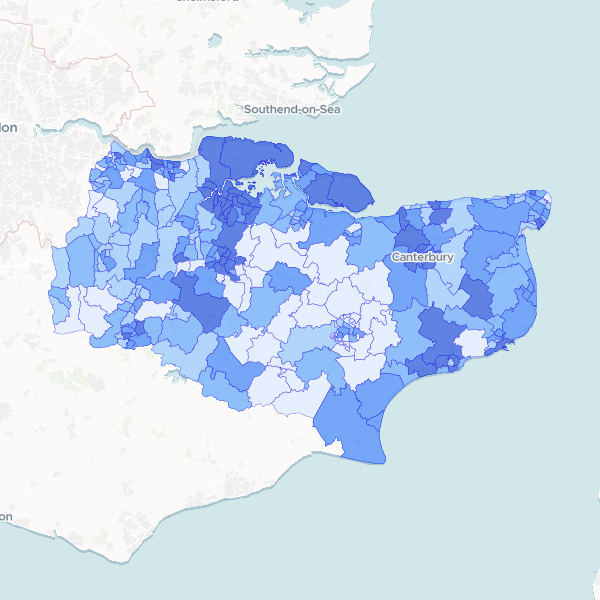
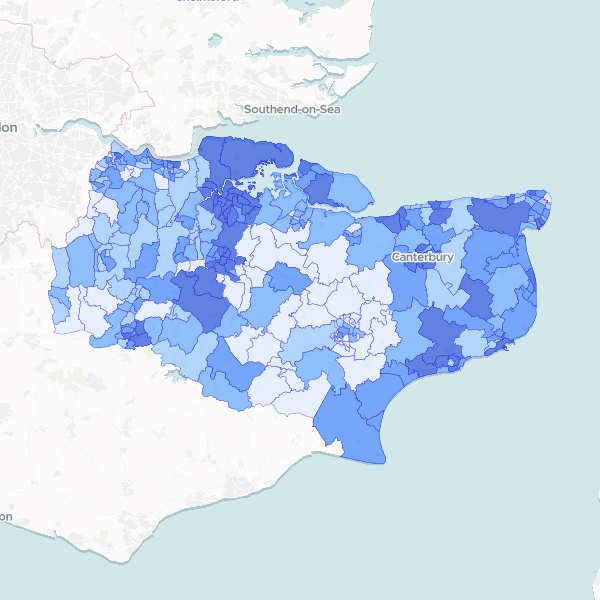
Kent Population by Ward
Total Usual Residents (2021) for Kent by 2022 electoral ward. This dataset is a full count. To compute population density, normalize this column against the area of each ward.
293 features
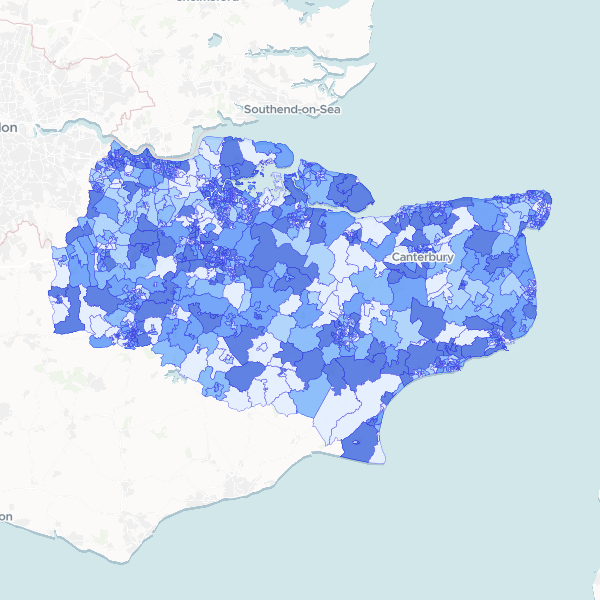
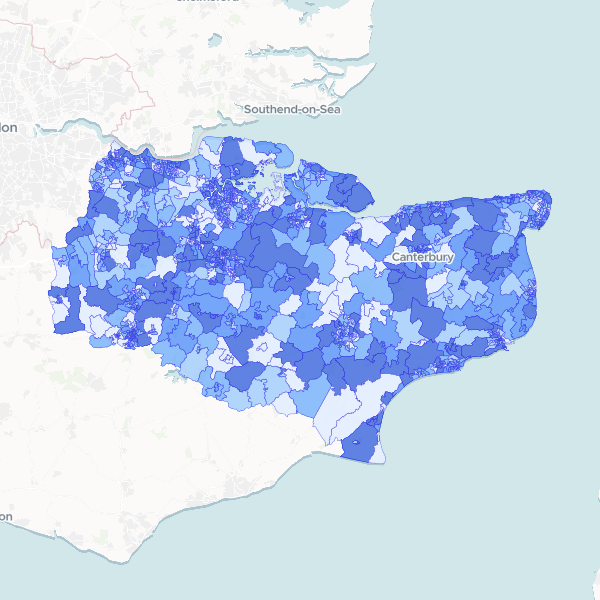
Kent population by LSOA
Total Usual Residents from the 2021 Census, published at Lower layer Super Output Area (LSOA) level. This dataset provides the population count per LSOA for Kent. Density can be calculated by dividing these counts by the LSOA area.
1,105 features
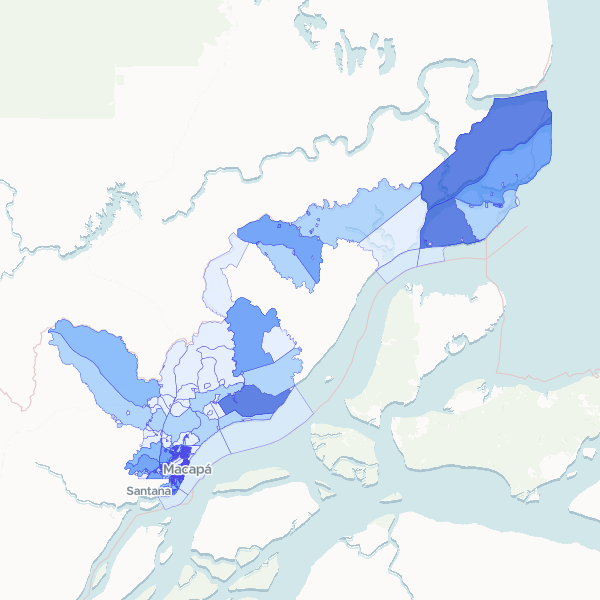
Macapá Population by Census Tract
Total population count in Macapá census tracts based on the 2022 Census (full count). To compute population density, divide these totals by the area of each census tract.
776 features
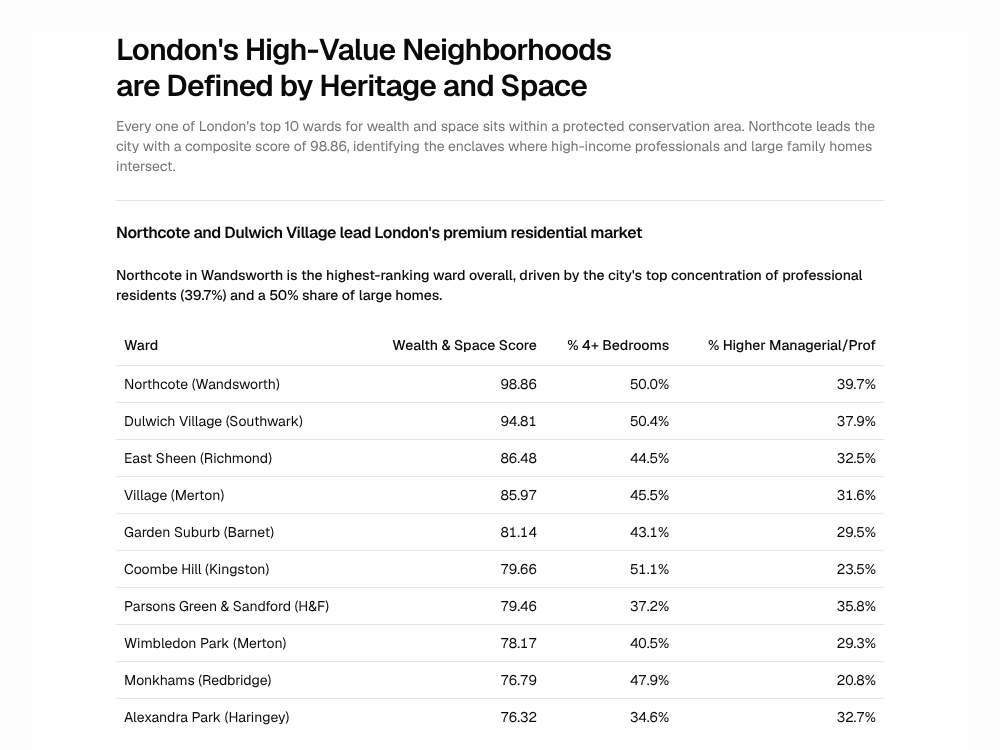
London's Premium Neighborhoods: Space, Wealth, and Heritage
Every one of London's top 10 wards for wealth and space sits within a protected conservation area. Northcote leads the city with a composite score of 98.86, identifying the enclaves where high-income professionals and large family homes intersect.
Report
London Higher Managerial and Professional Occupations by Ward
Higher managerial, administrative and professional occupations (NS-SeC L1-L3) as a percentage of all usual residents aged 16 years and over by electoral ward in London.
679 features
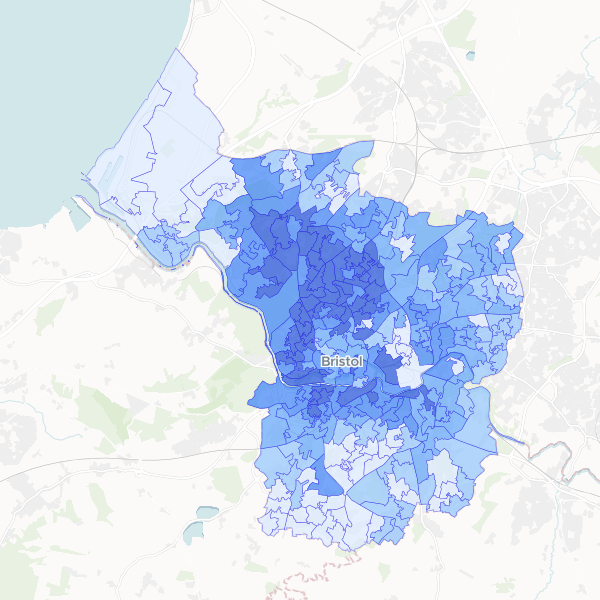
Bristol Higher managerial and professional occupations by LSOA
Higher managerial, administrative and professional occupations (NS-SEC L1, L2, L3) as a share of all usual residents aged 16+ by LSOA.
268 features
US Elderly Population by State
This dataset provides a state-level analysis of the elderly population in the United States. It includes total population counts, the specific count of individuals aged 65 and over, and the calculated percentage of seniors within each state's demographic profile. The data is derived from US Census Bureau statistics to help identify regions with higher concentrations of older residents.
50 features
Greggs locations by Greater Manchester ward
A spatial analysis showing the distribution and density of Greggs bakery outlets across electoral wards in Greater Manchester, including total population counts for demographic context.
Plymouth youth population (10-19) by ward
Youth population (aged 10-19) in Plymouth by electoral ward, with total population as denominator.
20 features
London: Premium Properties & Conservation Areas
A guide to London's premium neighborhoods, identifying wards with large family homes and high-income residents in close proximity to conservation areas. Top candidates include Northcote, Dulwich Village, and East Sheen.
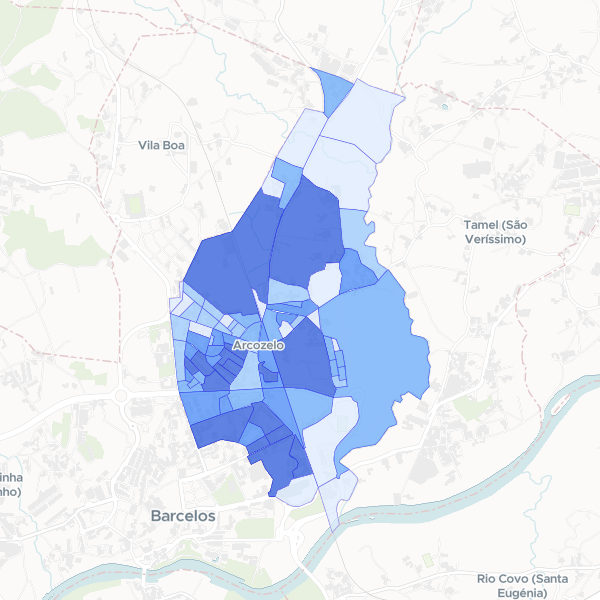
Arcozelo population breakdown 2021
2021 Census synthesis population breakdown by sex and age for Arcozelo (subseccao). Note: Income, education, and employment data are absent from this collection.
81 features
London Indian Population by LSOA
Indian ethnic group population (Asian, Asian British or Asian Welsh: Indian) and Total Usual Residents from the 2021 Census. This dataset contains only the Indian ethnic group population; other ethnic groups are excluded from this dataset.
4,997 features
Deprivation by LSOA in Greater Manchester
Households by number of deprivation dimensions in Greater Manchester. Deprivation is defined based on four dimensions: employment, education, health and disability, and housing. Normalise using Total Households to compute the proportion of households in each deprivation category.
1,702 features
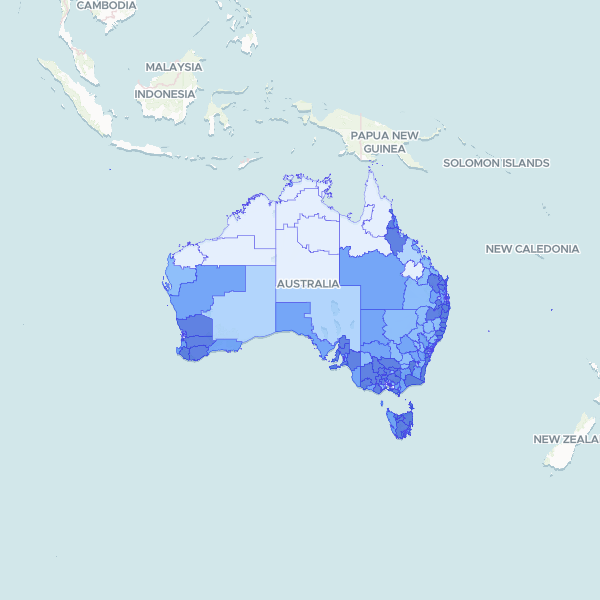
Australia Resident Profile by Statistical Area Level 3 (Medians)
Key demographic metrics: Median Age and Median Total Personal Income (Weekly) from the 2021 ABS Census at the Statistical Area Level 3 (SA3) level. Data is a full count from the Census 2021 General Community Profile. Tourism Regions were requested; SA3 level was chosen as an alternative.
340 features
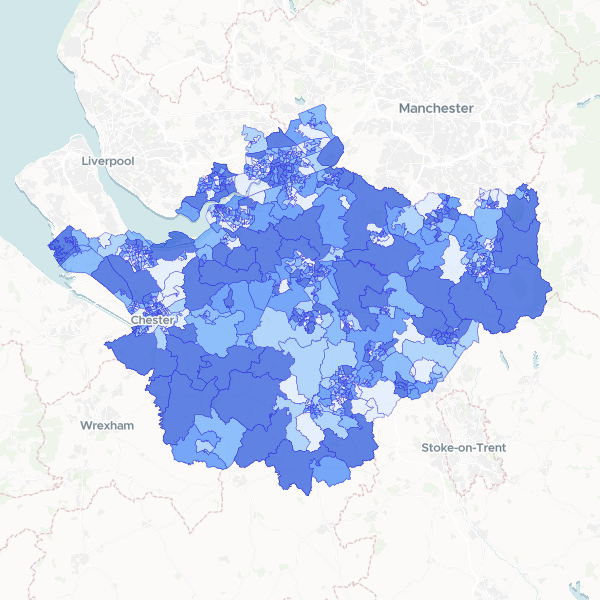
Household deprivation in Cheshire by LSOA
Households by number of deprivation dimensions in Cheshire (Census 2021, full count). Includes total households and number of households deprived in zero, one, two, three, or four dimensions, used here as a proxy for affluence.
678 features
NS-SeC by Kent LSOA
Socio-economic status (NS-SeC) breakdown by LSOA for Kent, using 2021 Census data. Contains counts for all occupational categories and the total residents aged 16+. Full-count data.
Kent Households by Deprivation Dimensions by Ward
Number of households in Kent by number of deprivation dimensions (from none to four), with Total Households as a denominator (Census 2021, full count). The dimensions cover employment, education, health/disability, and household overcrowding. Households not deprived in any dimension are included. Complete set of dimensions published.