8 free datasets tagged “poverty”. Open any one in Mapstack — no GIS skills, no download.
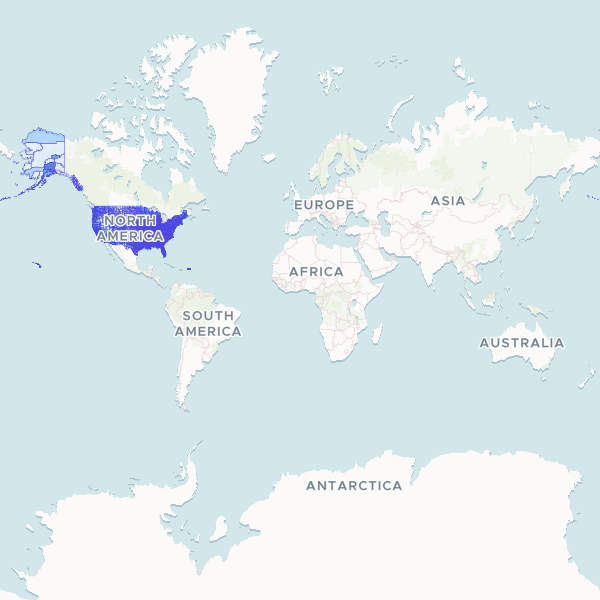
US county poverty status by educational attainment and sex (ACS 2023)
Poverty status in the past 12 months for the population 25 years and over, by sex and educational attainment, in US counties. Use 'Total Population 25 Years and Over' as the denominator to compute rates. American Community Survey (ACS) 5-Year sample survey estimates.
3,222 features
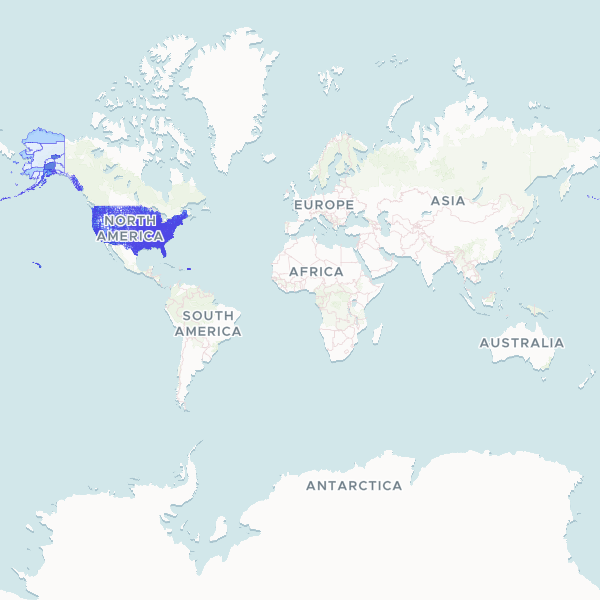
US county poverty status by population
Counts of individuals below poverty level and at or above poverty level, with total population for whom poverty status is determined, by US county, from the 2023 5-year American Community Survey. Normalize using Total Population for Poverty Status. This is a sample survey estimate, not a full count. Every value carries a margin of error (available separately).
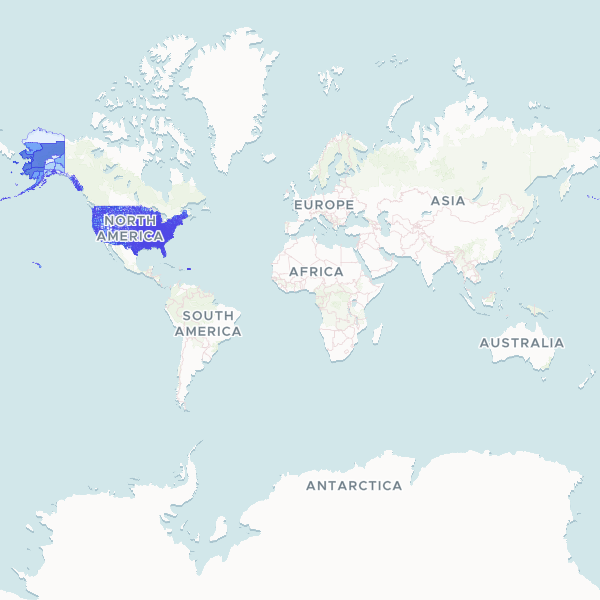
US County Poverty and Education
A comprehensive dataset of socioeconomic indicators across US counties, featuring poverty rates, unemployment figures, and educational attainment levels from the 2023 American Community Survey.
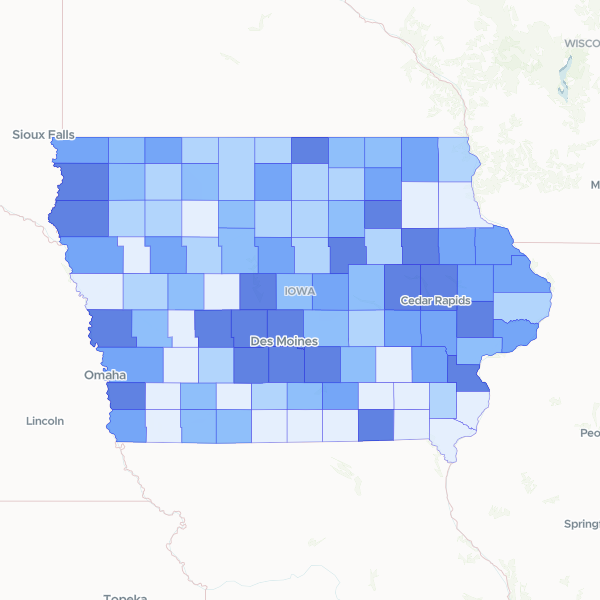
Iowa Median Household Income by County
Median household income in the past 12 months (in 2023 inflation-adjusted dollars) for Iowa counties.
99 features
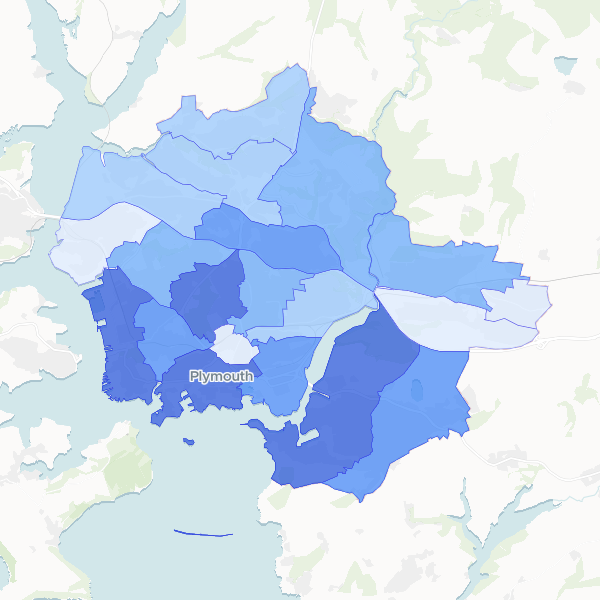
Plymouth household deprivation by electoral ward
Household deprivation status for electoral wards in Plymouth, based on 2021 Census table TS011. Measures households deprived in 0 to 4 dimensions.
20 features
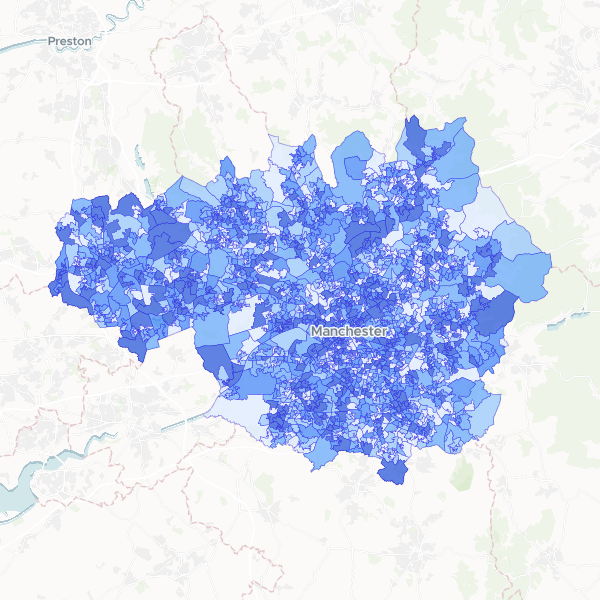
Deprivation by LSOA in Greater Manchester
Households by number of deprivation dimensions in Greater Manchester. Deprivation is defined based on four dimensions: employment, education, health and disability, and housing. Normalise using Total Households to compute the proportion of households in each deprivation category.
1,702 features
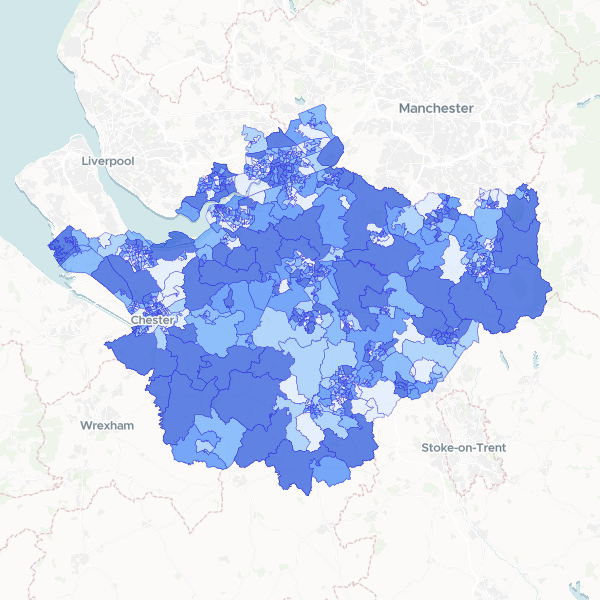
Household deprivation in Cheshire by LSOA
Households by number of deprivation dimensions in Cheshire (Census 2021, full count). Includes total households and number of households deprived in zero, one, two, three, or four dimensions, used here as a proxy for affluence.
678 features
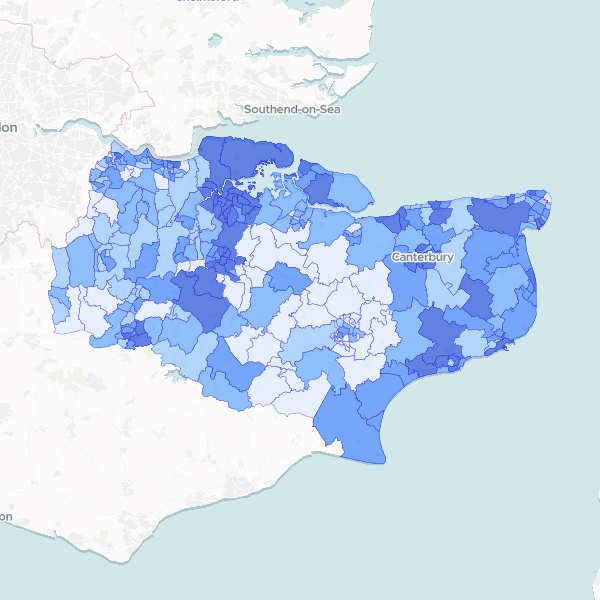
Kent Households by Deprivation Dimensions by Ward
Number of households in Kent by number of deprivation dimensions (from none to four), with Total Households as a denominator (Census 2021, full count). The dimensions cover employment, education, health/disability, and household overcrowding. Households not deprived in any dimension are included. Complete set of dimensions published.
293 features