11 free datasets tagged “household deprivation”. Open any one in Mapstack — no GIS skills, no download.
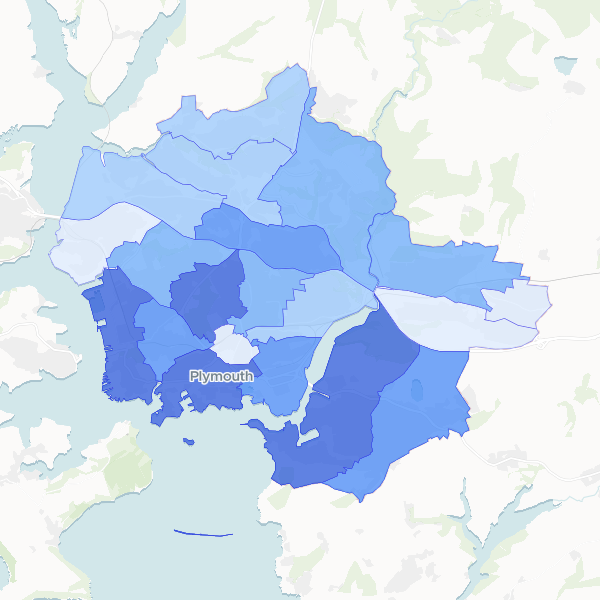
Plymouth household deprivation by electoral ward
Household deprivation status for electoral wards in Plymouth, based on 2021 Census table TS011. Measures households deprived in 0 to 4 dimensions.
20 features
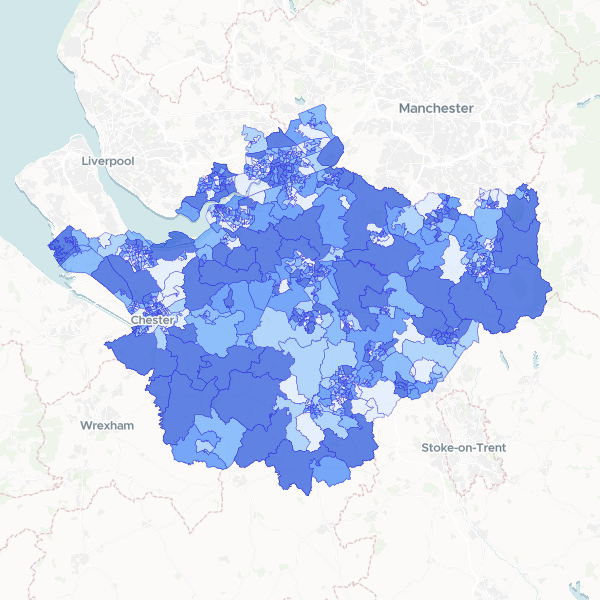
Household deprivation in Cheshire by LSOA
Households by number of deprivation dimensions in Cheshire (Census 2021, full count). Includes total households and number of households deprived in zero, one, two, three, or four dimensions, used here as a proxy for affluence.
678 features
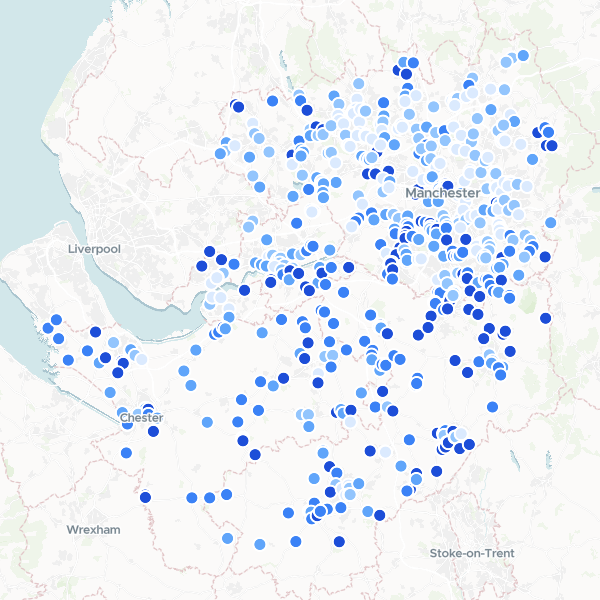
Garden Centres in Manchester and Cheshire by Affluence
A ranked list of garden centres and florists across Greater Manchester and Cheshire, enriched with local affluence data. The dataset combines business locations with census-based household deprivation statistics to identify retail sites in high-income areas.
627 features
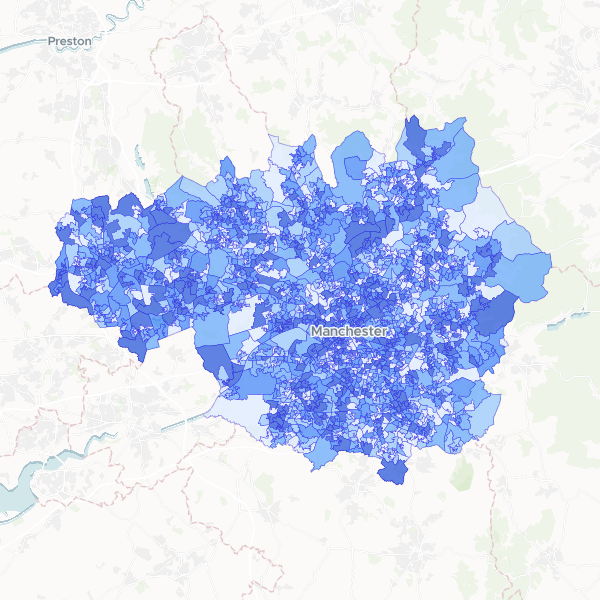
Deprivation by LSOA in Greater Manchester
Households by number of deprivation dimensions in Greater Manchester. Deprivation is defined based on four dimensions: employment, education, health and disability, and housing. Normalise using Total Households to compute the proportion of households in each deprivation category.
1,702 features
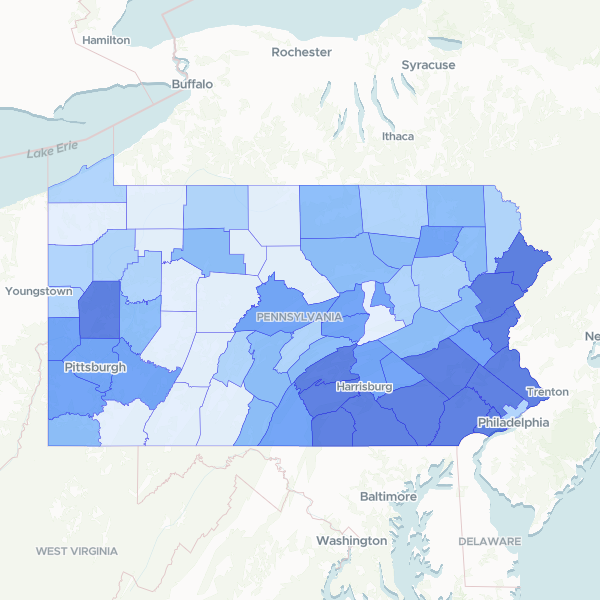
Pennsylvania Median Household Income by County
Median household income in the past 12 months in 2023 inflation-adjusted dollars, derived from the 2023 5-Year American Community Survey.
67 features
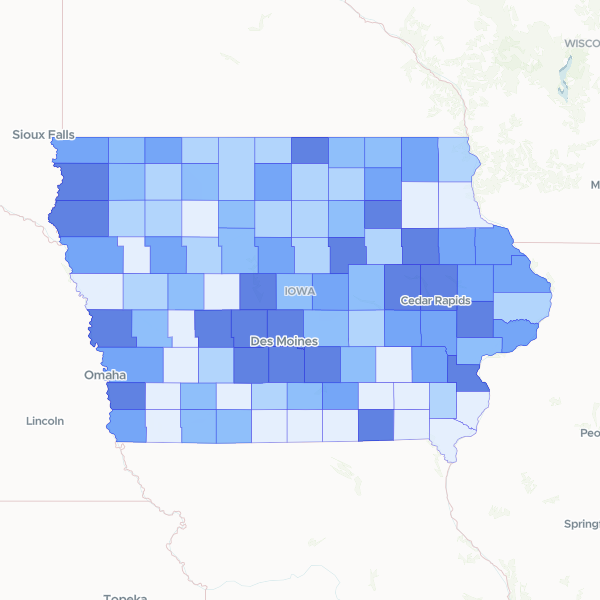
Iowa Median Household Income by County
Median household income in the past 12 months (in 2023 inflation-adjusted dollars) for Iowa counties.
99 features
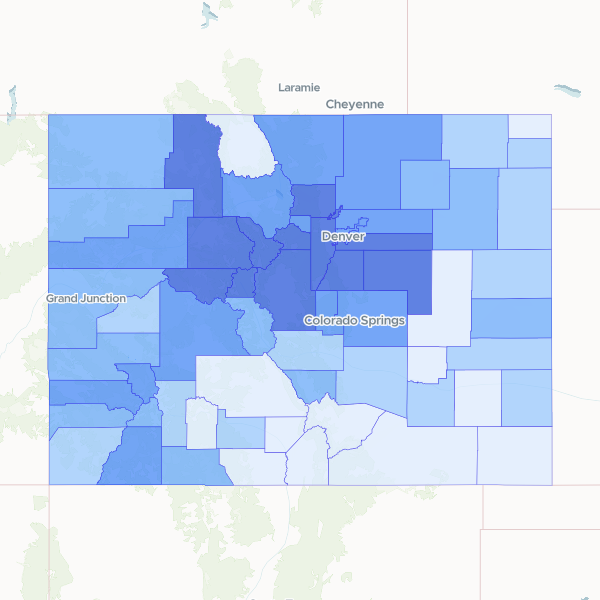
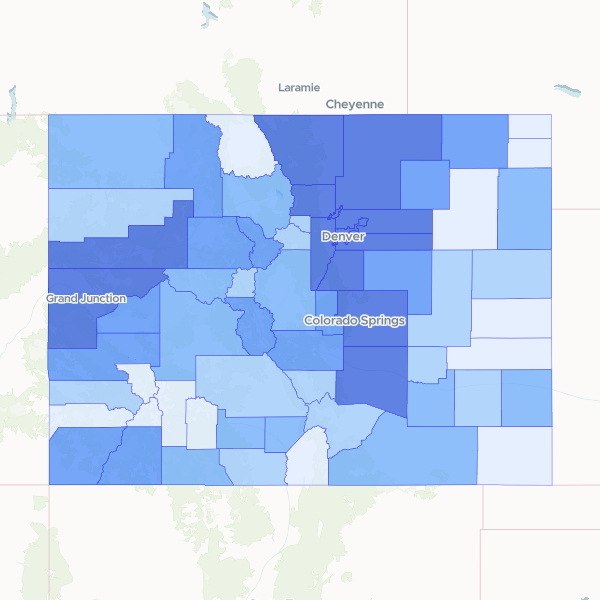
Colorado Median Household Income by County
Median household income by county for Colorado, based on the 2023 5-year American Community Survey. Household income is in 2023 inflation-adjusted dollars. Margin of error attributes are separate and excluded.
64 features
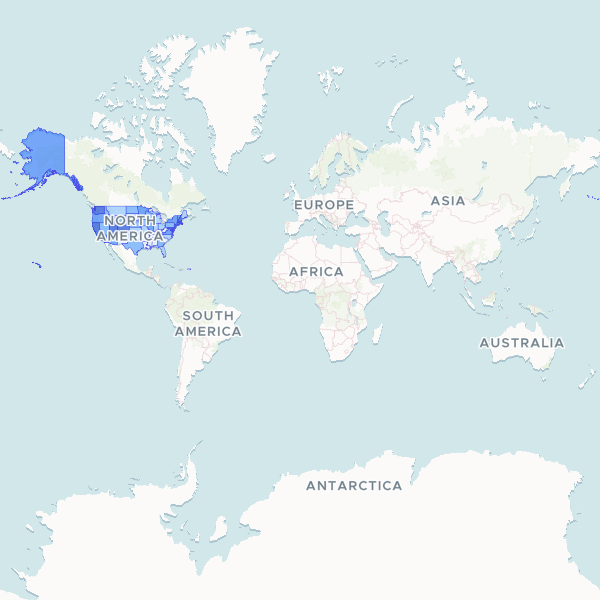
Median Household Income by State
Median household income in the past 12 months for 50 states, DC, and Puerto Rico, based on 2023 ACS 5-year estimates. This dataset uses sample-based estimates, which carry margins of error; margins are not included in this dataset. Median values should not be summed across areas.
52 features
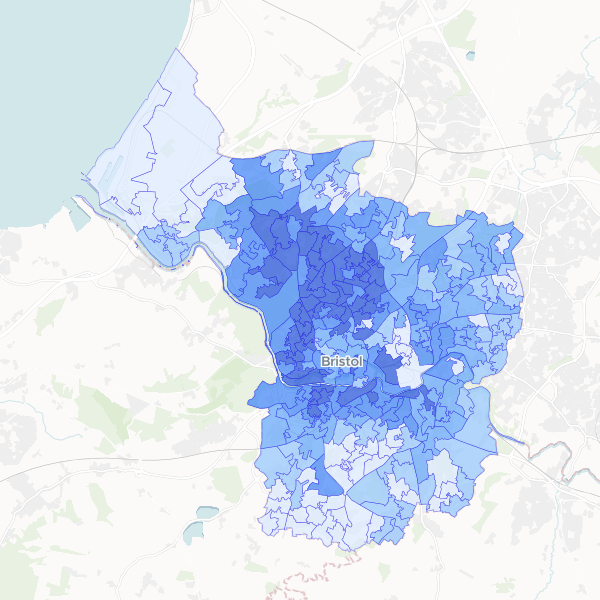
Bristol Higher managerial and professional occupations by LSOA
Higher managerial, administrative and professional occupations (NS-SEC L1, L2, L3) as a share of all usual residents aged 16+ by LSOA.
268 features
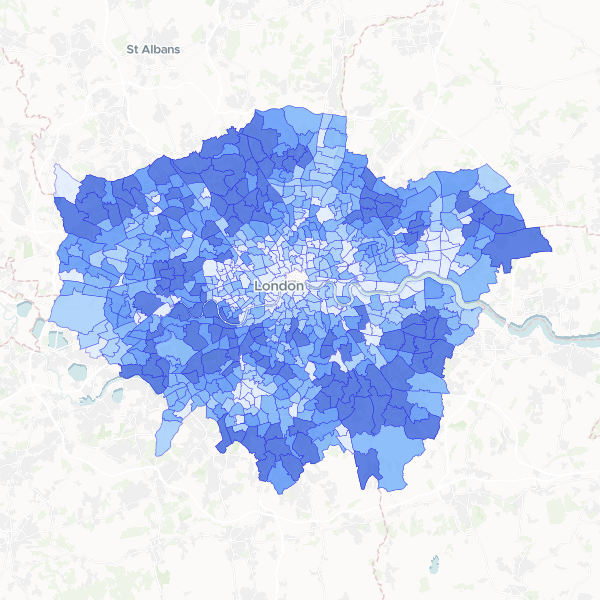
London households with 4 or more bedrooms by ward
Number of households with 4 or more bedrooms compared to total households by ward in London.
679 features
Colorado Population by County
Total population by county for Colorado, based on the 2023 5-year American Community Survey. Note: These are survey estimates, not a full count. Population density cannot be directly calculated from this dataset alone as it lacks land area in square miles. Household income is in 2023 inflation-adjusted dollars. Margin of error attributes are separate and excluded.