

Ask questions about your data
Ask in plain words or GIS terms for a figure, a ranking, a shortlist or a centre, and Mapstack works it out from your data and shows how.
Ask a question about the data in your session and Mapstack works it out: it chooses the method, runs it on your datasets and replies with the figures, the steps it took and the choices it made. Every figure comes from a step that ran on your data, never from memory.
Most location questions are about what lies inside, near or across something else. GIS people call this spatial analysis. You do not need the terms, and if you use them, Mapstack answers in them. These are the everyday questions of location data: how many in each area, the rate per head, the top ten, which records pass a test, where the middle of your customers is, which few addresses make most of the call-outs. The answer goes into an email, a table in a report, a map or the next question.
The asks on this page are examples of the kind of thing to say. Change the names to your own data.
- Who can use it
- Free, Creator and Creator Max. A Viewer can ask too, and gets answers but not new datasets.
- You provide
- At least one dataset in the session, and your question
- You get
- An answer with its working, the rows behind it, or a new dataset
Figures, tables and rankings
Start with at least one dataset in the session: upload a file, bring one in from your Library, or let Mapstack find data. Then ask your question, in plain words or GIS terms.
A real one: asked how many of Merseyside's active bus stops fall in each of Liverpool's 64 wards, Mapstack filtered the stops, counted them in each ward, gave the table for every ward and said that 5,173 of the 7,079 stops lay outside the city.
The answer comes in the conversation, with:
- the figures, as tables you can copy or download
- the steps it ran and how each was worked out
- the choices it made, each with its reason
- caveats: anything that limits how far a result can be trusted
- what it could not do, and what would let it
- one to three suggestions for what else the data could show.
It chooses the method, and tells you. Where your question leaves something open, Mapstack decides and says what it chose and why. Where the choice would change the answer and nothing in the conversation settles it, such as which of two columns you mean by "sales", it stops and asks, with a few options. Pick one or type your own answer, and it carries on.
It does not fill gaps with guesses. It will not stand one measure in for another your data lacks, and it does not work a figure out from an assumed one. It asks, or says what is missing. Where the missing piece is something it can fetch, such as census population, it fetches it. Anything from general knowledge is labelled as such.
It leaves out areas too small to trust. Before ranking areas by a rate, it drops the areas with very few people when the data has a population column, and says the minimum it used.
It asks before a large job. Work such as routing along roads for many places gets a card first, saying what share of your allowance it will use, with Go ahead and Don't run it. If you choose not to run it, nothing more is run. Analysis uses part of your allowance: see Your allowance.
It works on vector data. Points, lines, areas and tables. Imagery and scenes are for display. Asked for elevation statistics per ward from an elevation image, Mapstack said it cannot analyse imagery and offered what it could do instead.
How two measures move together. Ask whether one column rises as another falls across your areas. You get the strength of the link, which statisticians call the correlation, the line that best fits it, and what that line means in plain terms. Each area also gets the value the line predicts and how far it sits from it, so you can list the places that break the pattern.
Change between two columns. Where a table has a column for each year, ask for the change in number and in percent. You get it ranked both ways, with a count of the areas that fell.
See how two measures move together
Does diabetes rise as income falls across these tracts? List the areas that break the pattern
Get a figure, a table or a ranking
Say what you want to know. If you have a method in mind, say that too, and Mapstack follows it.
How many of our customers are in each county?
What's the rate per 1,000 residents in each ward, and which are the top five?
Spatial join the incidents to the wards, count them, divide by the mid-year population estimate and rank descending
Shortlists by value and location
For a test of location, have the other dataset in the session too, such as the flood zones or the stations.
"Inside" needs a decision at the edge. A parcel that touches the flood zone without lying wholly in it either counts or does not, depending on the test. Mapstack can test for anything that touches or overlaps, or only for what lies completely within. If it matters, say which you mean. The tests are listed under Reference on this page.
Distances in a test are straight lines. "Within 1 km of a station" is measured as the crow flies. For a walk or a drive, see Find who and what is within reach.
Picking records adds nothing. The result is the records that pass, with the columns they already had. To bring another dataset's values onto them, see Combine and reshape data.
Pick out records by value and by location
Tests on a record's own values (sales below target, a site over 1 hectare) and tests on where it sits (inside the flood zone, within 1 km of a station) go in one ask. GIS people call these select by attribute and select by location.
Which of our sites are inside the flood zone?
Which cafés are within 1 km of a station?
Which schools are not within 500 m of a park?
Find the parcels over 1 hectare that lie inside the flood zone, and keep them as a new dataset
Narrow a shortlist step by step
Change one test at a time and Mapstack builds on the last result.
Now only the ones more than 5 km from an existing hub
80-20 rankings
Bring a dataset of incidents: one point for each call, collision, complaint or other event. The ranking has no settings: one row per location, highest count first, with its count, its share of all incidents and the running share from the top.
An 80-20 ranking ranks places, not neighbourhoods. It answers "which locations come up most often", not "where on the map do incidents bunch together". A street where every house has one call-out does not appear near the top, though it may be a hot spot: see Find patterns, hot spots and clusters.
Find the few places that account for most of the total
Mapstack counts the incidents at each location, ranks the locations from most to fewest and adds the running share, so you can read off "20% of addresses account for 80% of calls". This is often called an 80-20 or Pareto analysis.
Which addresses account for most of our call-outs? Show me the 20% of addresses with the most calls.
Which roads have the most collisions, and what share of all collisions do the top ten account for?
Rank the stores by number of complaints, with the running share of all complaints
Centres and spread
Bring a weight column if some places count for more, and a category column to compare groups.
A centre is a starting point, not a site. It is worked out in straight lines, so it can fall in a lake, on a motorway or in the sea. Use it to narrow the search, then compare real sites by travel: see Choose where to go next. Unweighted, every place counts the same; weighted by orders, a few large customers can move the centre a long way.
Find the middle of a set of places
Weight each place by how much it matters and find the point in the middle: the centre of gravity, or mean centre. A few far-off places pull the mean towards them; the median centre is pulled less. Name a weight column if some places count for more.
Where is the centre of our customers, weighted by annual spend?
Give me the volume-weighted mean centre of the delivery points, and the median centre for comparison
Find the most central of your own places
The centre is a calculated point. If the answer must be one of your own sites, ask for the central one.
Which of our offices is the most central to all the others?
See which way places spread, and compare groups
An ellipse (GIS people say standard deviational ellipse) shows which way the places stretch and how far. Name a category column and you get one result for each category.
Which way do the incidents spread along the corridor?
Compare where each store brand is centred
Keep a result and build on it
Ask to keep a result and you get a new dataset, with a title, a record count and the method that made it, in the session and in your Library, ready for a map: the records that passed a test, the ranked locations with their running share, or a centre point or ellipse to put beside your places. Your originals are not changed.
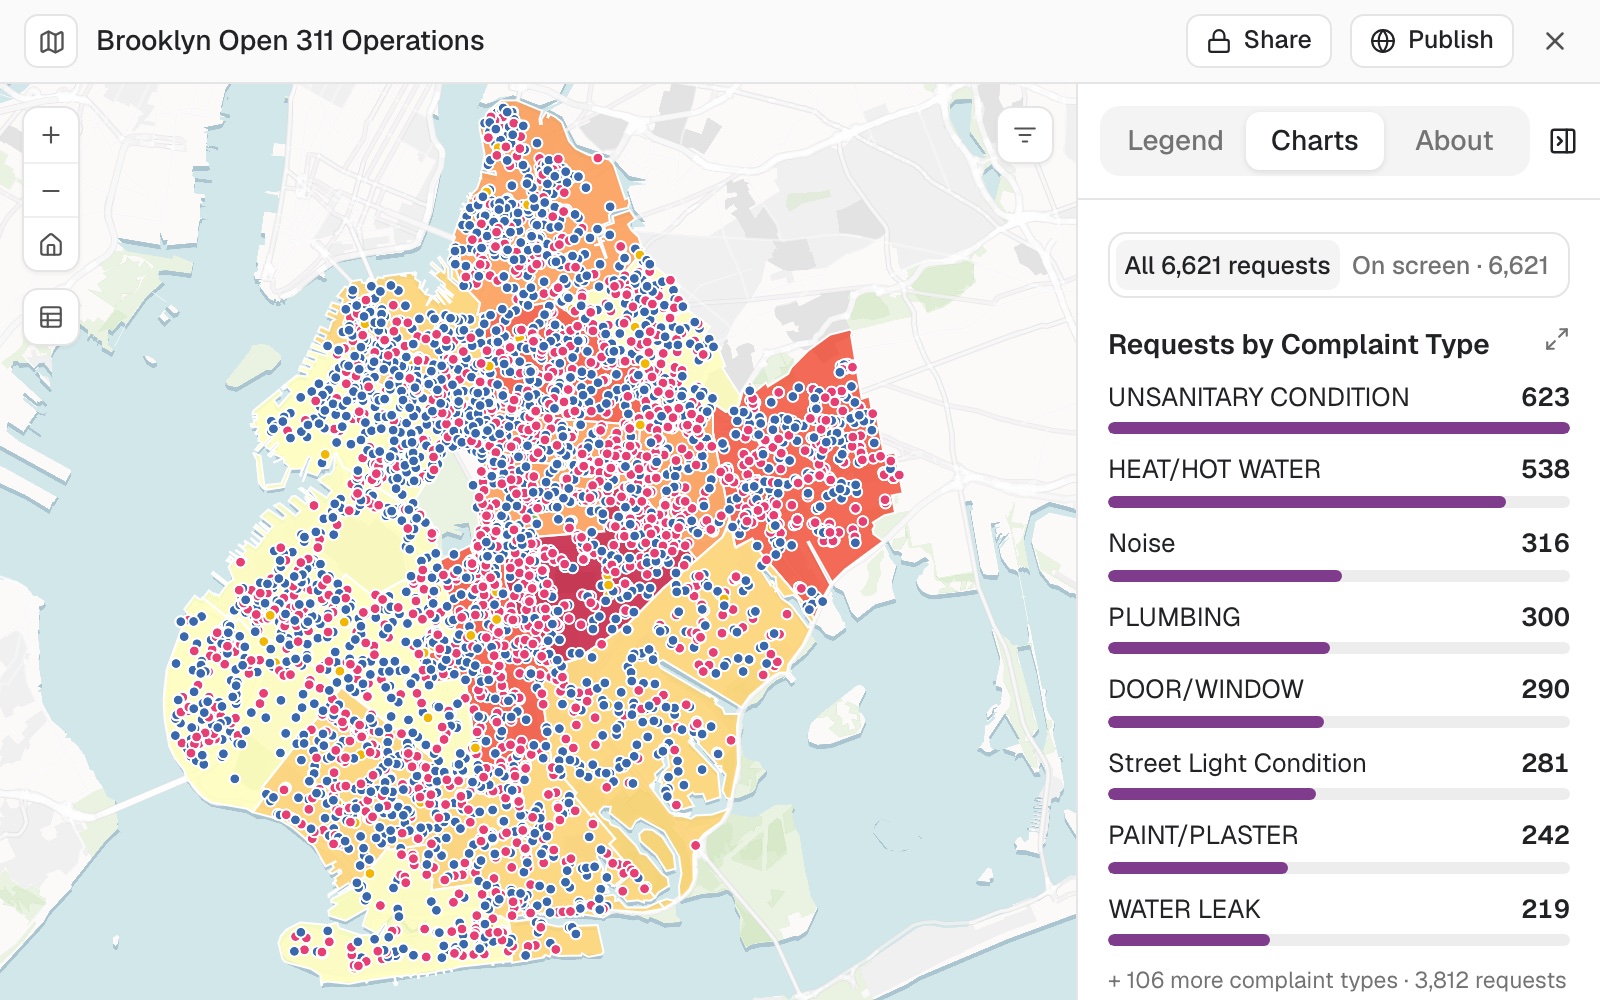 Example: Brooklyn's 311 requests not yet closed, coloured by status, over the community districts shaded by how many open requests each has, District 17 darkest at 417. The chart counts the 6,621 placed requests by complaint type.
Worked through in the guide Operations dashboard.
Keep the result
A result you keep becomes a dataset of its own. If it is for a map, say so: a map draws columns, so Mapstack puts each answer in a column, such as whether each café is inside the walk area.
Give me that as a dataset
Make a dataset of the cafés with a column saying whether each is inside the 10-minute walk, so I can map it
Carry on from the last answer
A follow-up builds on the results it already has, so it does not start again.
Narrow it to the north region
Run the same thing on this year's file
See the working and the rows behind it
It explains how it got there. The reply sets out the steps, the coordinate system where it matters and the date of each input. It says when it made a judgement call: working out who could walk to a bus stop in Liverpool, it kept the stops just outside the city so that people living near the edge were counted.
The working stays with the result. In the conversation, each step shows its name and what it is for. Every dataset an analysis makes carries How this was made in its Details, in plain words. For the exact settings or the query behind a step, ask for them in the conversation.
Choose records by hand. Open the dataset and select Select. Pick them on the map with Click, Rectangle, Polygon or Lasso, or tick rows on the Table tab. Your selection goes with your next message, so you can ask about "the selected rows". This needs a Creator seat.
Highlight the rows behind an answer
Open the dataset beside the conversation first. Every row behind the answer is selected, not only the rows shown in the reply.
Select the shops with no pharmacy within 1 km
Select them on the open dataset
Clear the selection
Find out where a figure came from
On an open report, Mapstack runs the report's steps again over the data it was made from and tells you how the figure was reached.
Where does the figure in the headline come from?
Reference
| What it reads | Datasets: points, lines, areas and tables. Not imagery or scenes |
| Distance unit in a test | Metres unless you say otherwise |
| Selecting rows | Replaces the selection or clears it, on an open dataset |
| A result you keep | A new dataset. Your originals are not changed |
| Very large results | See Sizes and limits |
| Test of location | A record passes when it |
|---|---|
| Intersects | Touches or overlaps a feature of the other dataset |
| Within a distance | Is within the distance you give of one |
| Completely contains | Wholly contains one |
| Completely within | Lies wholly inside one |
| Does not intersect | Touches none |
| Not within a distance | Is further than the distance you give from every one |
| Centre and spread | What it is |
|---|---|
| Mean centre | The average position: the centre of gravity |
| Median centre | The position with the least total distance to every place. Pulled less by outliers |
| Central feature | The one of your own places nearest all the others |
| Ellipse | The direction and extent of the spread. Its size can be set |
Any centre can be weighted, and worked out for each category.
On a Viewer seat you can ask questions of anything in the workspace, including picking out records, centres and spread, and 80-20 rankings. Distances are straight-line only, and results are answers, not new datasets.
What it can't do
- Analyse imagery or scenes. It reads datasets only.
- Answer from a measure your data does not hold by substituting another one. It asks, or fetches the real one.
Common questions
Do I need to know GIS to ask?
No. Ask the way you would ask a colleague. If you do know the terms (spatial join, select by location, natural breaks, network distance), use them: Mapstack follows the method you name.
Is my data changed?
No. Analysis reads your datasets and makes new ones. Your originals stay as they were. To change a dataset itself, see Edit your data.
How do I see where a figure came from?
Ask: 'How did you work that out?' With the dataset open beside the conversation, ask Mapstack to select the rows behind it too. Check them as you would a colleague's working.
Does a record that touches the edge count as inside?
That depends on the test, so say which you mean: anything that touches or overlaps, or 'only the parcels completely within the flood zone'. Anything you leave open, Mapstack chooses and tells you which.
Can I rank areas instead of addresses?
Yes, in two asks. Count the incidents in each area first ('Count the call-outs in each ward'; see Count and summarise by area), then ask for the ranking of the areas.