

What Mapstack is
Mapstack is an AI teammate for maps and location work: you say what you need, and it brings in the data, runs the analysis and makes the result.
Mapstack is an AI teammate for maps and location work. You say what you need in a conversation, in your own words. Mapstack brings in your data or finds it, prepares it, runs the analysis and makes the result: an answer, a dataset, a map, a report, a print or an app. You check what it made and decide what to do with it, as you would with a colleague's work.
It is for anyone whose work turns on where things are: where customers are, which areas a service reaches, which sites sit in a flood zone. You need no mapping software and no mapping terms. If you already use GIS (a geographic information system, the software mapping professionals use), ask in its terms, such as a spatial join, natural breaks or a coordinate system, and Mapstack answers in them.
What it makes
Everything Mapstack makes is one of seven kinds of thing, plus answers in the conversation. A dataset, map, report, print or app keeps its earlier versions, so you can go back.
| Thing | What it is | Use it to |
|---|---|---|
| Answer | A figure, a list or a short table, in the conversation | Settle a question |
| Dataset | Your records, each with a place on the earth (a point, a line or an area), or a plain table. It keeps its sources, a date and its earlier versions | Check, edit or download the data |
| Map | A live view of one or more datasets, with a legend, search, pop-ups, filters and charts, in 2D or 3D | Let people explore |
| Report | A dated written document: the headline finding, key points, maps, tables and appendices. Downloads as PDF or Word | Hand someone the findings |
| One designed page to a paper size, with a title, key, scale, north arrow and sources. Downloads as PDF or PNG | Put a map in a document, a slide or on paper | |
| App | A small web tool for a named audience, such as a lookup for colleagues | Give people something to use |
| Imagery | Satellite and aerial photos, elevation and other gridded data | Show what the ground looks like |
| Scene | One 3D survey or model: a point cloud, a mesh or a building model | Show it in 3D, on a map |
Datasets feed everything else. Maps show datasets; analysis reads datasets and writes new ones; reports, prints and apps are built from the maps and datasets. So most work starts with data, and the numbers agree across everything made from it.
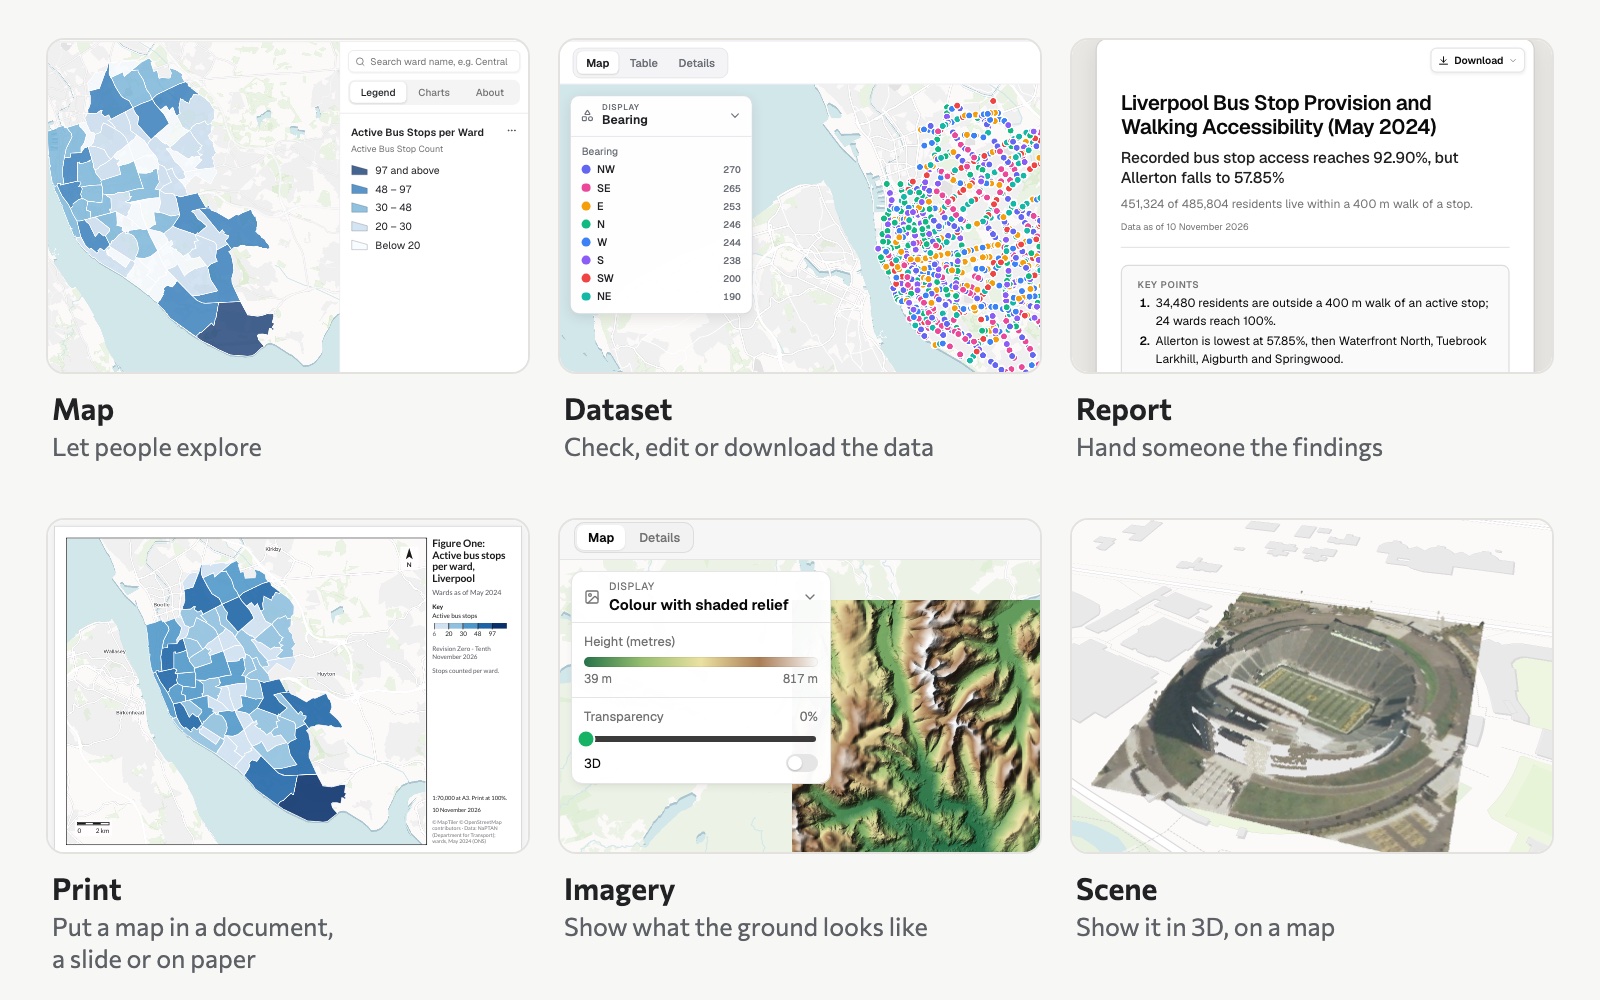 Six of the things Mapstack makes. The map, dataset, report and print are all built on Liverpool's 1,906 active bus stops; the imagery is an elevation model of the Lake District, and the scene a lidar survey of Autzen Stadium in Eugene, Oregon.
See What Mapstack makes.
Where your work lives
You work in a session: one conversation, and the files and things it is working with. Each request builds on what the session already holds, so one job can run start to finish in one session: bring the files in, join them, analyse, then make the map, the report and the print.
Everything a session makes goes into your workspace's Library the moment it exists. There is nothing to save. Anyone with a seat in the workspace can open it, and a later session can use it without uploading again. A project gathers the sessions and things that belong to one piece of work.
See Start, find and manage sessions and Find your work in the Library. Who can see your work, where it is kept and how AI is used on it: Your data, privacy and security.
Some things are asked for, some are clicked
You ask for anything that makes or changes your work: bringing data in, finding data, cleaning and joining it, every analysis, and making or changing every map, report, print, app, imagery item and scene.
You click for running the workspace: projects, routines, settings, sharing, publishing and downloads. Ask Mapstack to do one of these and it tells you that it is done on screen, and gives you the steps.
What it takes and what it finds
Your own data. Spreadsheets of addresses, coordinates or area names; GIS files such as GeoJSON, shapefiles, GeoPackage and KML; satellite and aerial imagery and elevation; LiDAR point clouds and 3D models; files from Google Drive, OneDrive or Dropbox. Several files can go in one message. See Attach a file.
Data it finds. Ask for data you do not have and Mapstack looks for it: datasets in Mapstack's public catalogue and then on the open web, preferring official sources; places and businesses in an area; census and other official statistics by area; and boundaries. It says where each came from and how recent it is. See Search for datasets.
What it does with the data
Ask a question and Mapstack runs the analysis behind it. It covers the familiar kinds of GIS analysis: counting and summing inside areas, what is near each place and the nearest one, walking and driving distances along the road and path network, enriching areas with official statistics, hot spots and clusters, territories, and choosing sites. Analysis works on datasets: points, lines and areas, and tables. See Ask a question about your data.
How it differs from asking a chatbot for a map
A general chatbot answers from what it has read. Mapstack works on data: every figure comes from a step it ran on your data, or on data it fetched and named (a count, a join, a travel-time calculation), never from memory. What it makes is kept, as datasets you can open, check row by row and download, and the maps and reports built on them. And it tells you the method, so you can check the work the way you would a colleague's.
What it doesn't do, by design
These are choices about how Mapstack works, each with the way to get what you are after.
- A map has no download button. A picture of a map is a print, which Mapstack designs from your description. A print is one page, with a second page for the key when a large dataset is numbered on the map. It does not make map books or atlases.
- A print is changed by asking, not by editing the picture.
- A map holds no text. The write-up goes in a report; the map stays a live view of its data.
- There is no style editor. Every change to how a map looks is asked for, and you can be as exact as you like: colours, class breaks, line widths, transparency, labels, the zoom levels something shows at.
- Imagery is for display. Analysis works on datasets, not on imagery: there are no zonal statistics or raster calculations. Asked for one, Mapstack says so and offers what it can do instead.
- A scene is one survey or one model, shown on an ordinary map.
- An app changes only when you ask for it in a session. A routine can update datasets and maps on a schedule, not apps.
- A Viewer seat does not make things. It opens what others made and asks questions about it.
You are the reviewer
Much of Mapstack's work involves judgement: matching an address to a place, reading what a request means, choosing a design. Like a person doing the same work, it can read something more than one way and pick the wrong one. So it tells you what it did: the method, the date of each input, the calls it made for you and what it did and did not check. Read that the way you would read a colleague's notes, and look at the result before you use it.
Ask for the same thing twice and the results will not be identical. See How Mapstack works with you.
The facts
| Seats that make things | Free, Creator and Creator Max |
| On Free | Answers, datasets and maps. Reports, prints, apps, imagery and scenes need a Creator or Creator Max seat |
| Viewer seat | Opens everything in the workspace and asks questions about it; makes and changes nothing |
| File sizes and records | See Sizes and limits |
| Usage | Every request uses part of your allowance. See Your allowance |