

Work with lines, routes and tracks
What a route crosses, what lies along it, a network kept as a register, and tracks built from timed positions.
A line is not a thin area. A road, a pipeline, a walking route or a day of ship positions has a direction, a length and a distance along it, and the questions people ask of one are its own:
- What does it cross? Every road, railway and river a route meets, in the order you would walk it.
- What lies beside it? The people, homes and sensitive places within a distance of each stretch.
- How much of it is whose? A network totalled by owner, material or condition.
- Where was it, and when? Positions with a time on them, joined into a track you can play.
Bring the line as a GIS file, or bring the timed points and Mapstack builds the line. What you get back is a dataset each time: the crossings, the stretches, the tracks. They are yours to open, check, map and download.
Two real files run through this page, one for crossings and one for tracks. The asks in the other sections are examples of the kind of thing to say.
- Who can use it
- Free, Creator and Creator Max
- You provide
- A line, or timed points to build one from
- You get
- A dataset of crossings, stretches, tracks or totals
What a route crosses
The example here: the Wigan Beeway, a 7.58 km walking and cycling route from Appley Bridge to Wigan Pier, one record from Transport for Greater Manchester's Bee Network file. It is tested against the roads, railways, watercourses and pipelines that OpenStreetMap holds around it. It has 18 crossings.
How a crossing is found. A crossing is a place where another line passes from one side of your route to the other. Mapstack finds each one, numbers them from the end you name, and reads what the data says about it: the name, the road or line number, and the arrangement where it is recorded, such as a bridge, a viaduct or a culvert. It is the schedule a surveyor would draw up by walking the route, made from the data.
A line that runs alongside is not a crossing. This is the judgement that matters most. The Leeds and Liverpool Canal follows this route for most of its length, and the two lines touch again and again along the towpath. That is one crossing, where the route goes over the canal, not twenty. Mapstack leaves the rest out and says so. If you want the stretch alongside reported as well, ask for it.
Two carriageways are one road. The M6 crosses on Gathurst Viaduct as two separate carriageways, and the railway beside it as two tracks. Ask for them to count once each and they do.
How far along. Each crossing carries its distance along the route from the end you name. Highways and rail people call this the chainage. The M6 is 2.56 km from Appley Bridge, and the railway 60 metres beyond it. If your file is in a national grid, such as British National Grid, the grid reference of each crossing comes back in it.
Say how small a road counts. Motorways and railways are never in doubt. Farm tracks, service roads and unnamed lanes are a choice, and 4 of the 9 road crossings here are tracks or service roads. Name the kinds you want in or out.
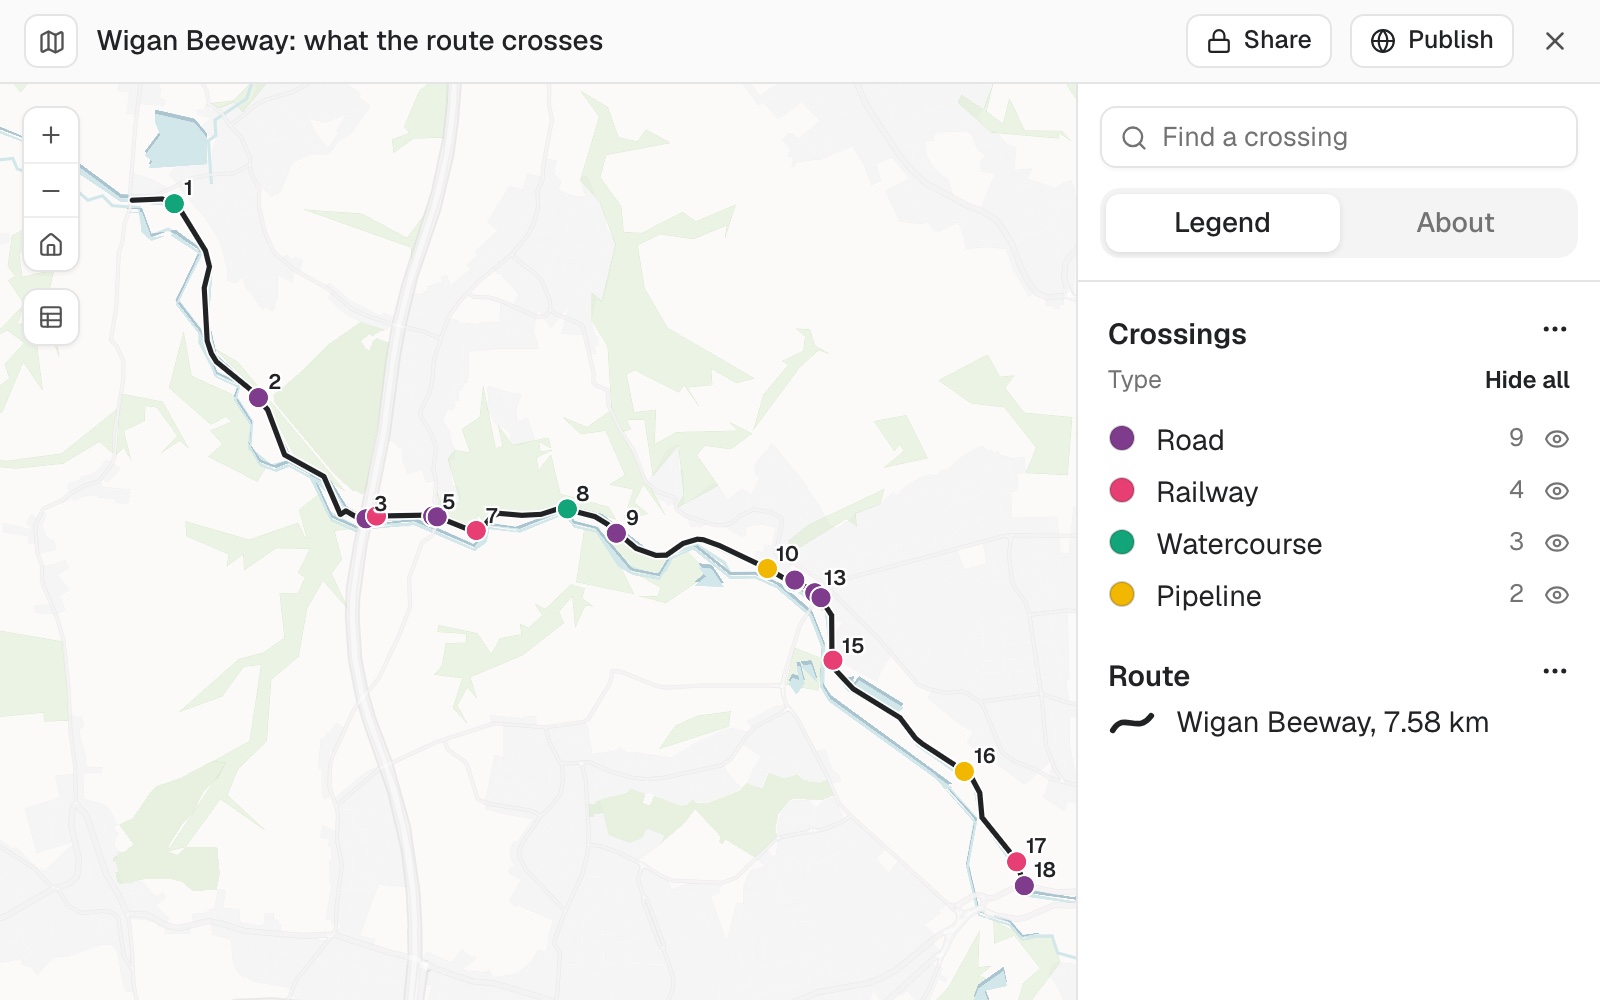 Example: the Wigan Beeway's 18 crossings, numbered from Appley Bridge: 9 roads, 4 railway crossings, 3 watercourses and 2 pipelines. Where two sit close together, as the M6 and the railway beside it do at number 3, one label is drawn.
List everything a route crosses
Attach the route and the features to test it against, or ask Mapstack to find the roads, railways and rivers around it. Name the end distances are measured from.
List every road, railway, watercourse and pipeline this route crosses, numbered from the Appley Bridge end, with the distance along the route to each
Tidy the schedule
Two follow-ups an engineer asks of every first schedule. The first merges the parts of one road or railway. The second sets how small a road still counts.
Count twin carriageways and parallel tracks as one crossing each
Include farm tracks and service roads
Split a line into stretches
A long line is easier to act on in pieces. Ask for stretches of a length you choose, and Mapstack cuts the line into numbered sections from the end you name. Then it answers your question for each stretch separately, so a pipeline becomes a table with one row a mile.
Each stretch has its own surroundings. The people and homes inside a corridor on either side come from census areas, shared out by the part of each area that falls inside. The rivers, protected land and sensitive sites within a distance you set are named, not only counted.
Your own rating, stretch by stretch. Give the thresholds for high, medium and low, and Mapstack rates each stretch. When your rule puts every stretch in the same class, it says so plainly and ranks what matters most anyway. More in Score, rate and cost by your own rules.
Cut a line into stretches and report on each
Split the pipeline into 1-mile stretches from the west end
For each stretch, give the people and homes within 200 metres and the watercourses within half a mile
What lies along a route, and what it would cost
Give Mapstack a route and the things near it, and it counts what lies within a distance you give, filtered the way you say: proposed only, active only, by a code. It measures the line itself too.
Every counted item can be traced. Each one comes back with its distance along the route and how far it sits from the line, so a line of an estimate points at a place on the ground.
It will price the count with your rates. Give your unit rates and an uplift, and you get a table of item, quantity, rate and cost with the subtotal, the uplift and the total. Change the rates and the same quantities are priced again, so a low and a high column give you a range to quote.
Count and price what is along a route
Count the proposed crossings, junction improvements and bus stops within 100 m of the route
Price it with these unit rates and add 30%, then give me a low and a high figure
Keep a network as a register
A pipe, cable or road network is a register like any other, with one record for each stretch. For the same job on point assets, see Keep a register of your assets on a map.
Bring the network as a GIS file. You get a map of it coloured by what matters, such as who owns and maintains each stretch, its material or its condition. Each stretch shows its own figures when a reader selects it, and the map has a search by reference and filters.
Length totalled by any column. Kilometres by owner, by material or by pressure zone, with shared stretches counted on their own.
It looks for gaps in the records. Sizes recorded as zero, a code standing in for a missing material, install dates that cannot be right, the same owner spelled two ways. These become their own dataset to send to whoever keeps the records, and a layer over the register map. More in Check your data for problems.
Turn a network file into a register
Make a register map of these water mains, coloured by owner, with a search by main ID
Total the length by owner, and show me the records with missing or impossible values
Build tracks from timed positions
The example here: one day of ship positions in Elliott Bay, Seattle, from the United States Coast Guard's AIS records as published by NOAA. It holds 2,993 position reports from five vessels, one a minute for each, with the vessel's name, the time and its speed.
From points to a path. A file of positions is thousands of dots. Ask, and Mapstack places every one, then joins each vessel's positions in time order into one line: its track. The track is its own dataset, so you keep the path and the positions both.
A track can be played. The time slider steps through the day in intervals you choose. Ask for it to show only the positions inside each step, drawn over the tracks, and you watch the vessels move along their lines.
Times in the zone you name. Position files are usually stored in UTC. Name the place or the time zone, and the slider and the written summary both use it. The file is left as it is.
It writes the day up. From the positions alone: how many crossings a ferry made, when a boat left and when it came back, the hours a working vessel was active.
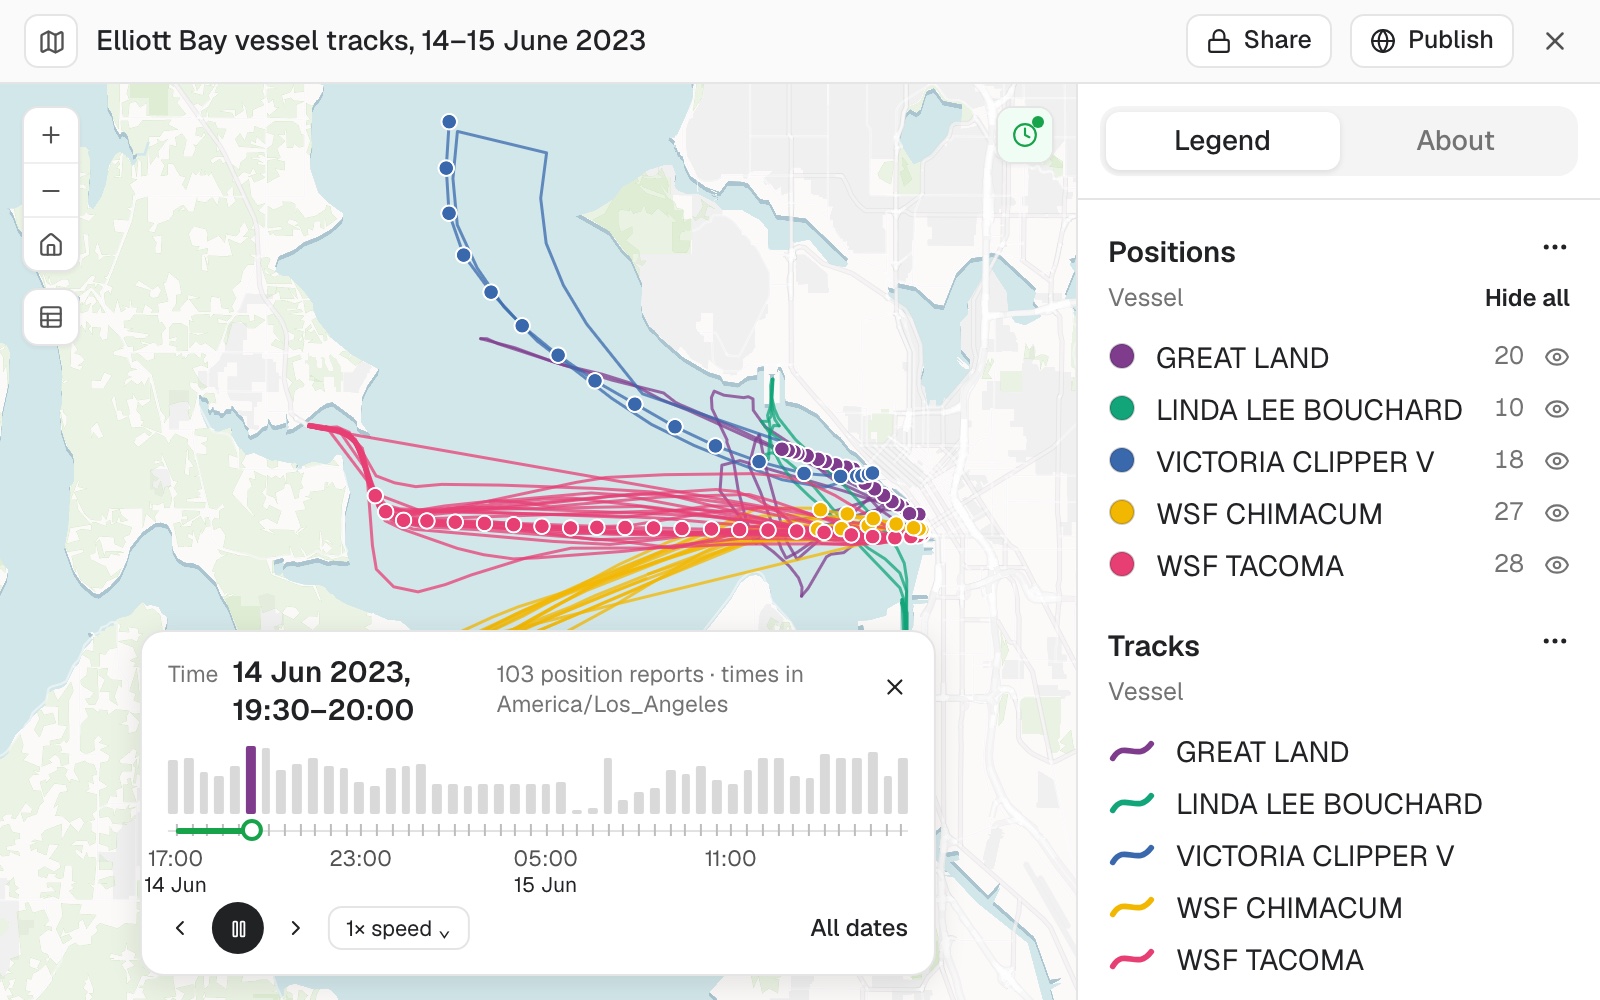 Example: five vessels in Elliott Bay on 14 and 15 June 2023. Each line is one vessel's track for the day. The dots are the 103 positions reported between 19:30 and 20:00, Seattle time, the step the slider is on. The pink band running west is one ferry's crossings.
The area a subject used. For animals with tracking collars, ask for the area that holds a stated share of each one's positions, such as a 95% home range. You get one area for each animal. From a year of positions, Mapstack will also say which animals stayed put and which moved between ranges, with the date each left and returned.
Turn timed points into tracks and play them
Build a track for each vessel from these position reports, and let me play the day in 30-minute steps
Show the times in Seattle time
Summarise what each one did
How many crossings did each ferry make, and when did the passenger ferry leave and return?
Draw the area a subject used
Give me a 95% home range for each animal
Movement between places
Where your table holds both ends of a journey, an origin and a destination on each row, Mapstack draws the line between them. Each line is as thick as the number it carries, so the large movements read at a glance, and it shows its figures when a reader selects it.
It will total the table as well as draw it. Journeys into each place, out of each place, and the balance between the two. It also gives the share of all movement that crosses a boundary you name.
Draw movement between places
Draw a line from each origin to each destination, with the width by the number of workers
Total the journeys in and out of each county, and tell me what share cross a county line
Join stops into a line in your own order
Where the order is yours and not the shortest way round, say so. Numbered stops are joined one to the next in the order you give, as a line dataset drawn under the stops. To have Mapstack work the order out, with several vehicles or a time at each stop, see Build territories and plan routes.
Join stops in the order you give
Join these 22 stops into a walking line in their numbered order
Reference
| Lines it takes | Any GIS file it can read. See Upload a file |
| Crossings | What is crossed, its name and number, the arrangement where the data records it, and the distance along the route |
| Grid references | In your file's national grid when it has one |
| Stretches | A length you choose, numbered from the end you name |
| Along a route | Counts within a distance you give, each item with its distance along the line and from it |
| Length totals | By any column on the line |
| Tracks | One line for each subject from timed points, kept as its own dataset |
| Playback | The time slider, in steps you choose, in a time zone you name |
| Movement between places | A line for each origin and destination pair, its width by a value, with the totals in, out and net for each place |
| Measurements | On the WGS 84 ellipsoid, so they hold anywhere on the earth |
| Very large files | See Sizes and limits |
What it can't do
- Work out the best order of stops on this page. Say the order, or ask for a route to be planned: see Build territories and plan routes.
Common questions
Can it tell a crossing from a road that runs alongside?
Yes, and it says which it left out and why. If you want the stretch alongside counted too, say so.
How do I get the distance along the line?
Name the end to measure from and ask for it. Every crossing or item then carries its distance along the route.
My positions are in UTC. Can the map show local time?
Name the place or the time zone. The slider and the written summary both use it, and the file is left as it is.
Can I keep the track and the points?
Yes. The positions stay as one dataset and the tracks are another, so you can map, filter or download either.