

Get census and official statistics
Ask for a measure such as population, age or income for a place, and get it by area, as the statistics office published it.
Ask for a measure in your own words (population, age, income, housing and who owns or rents, households with and without a car, employment, education, origin) for a place you name. Mapstack finds it in the official statistics for that country and gives you a dataset of the areas inside the place, each with the figures as the census or statistics office published them, and says which release, year and level they came from. Ask a question of the figures and you get the answer in the conversation. You do not need to know what the table is called or what the country calls its small areas: Census 2021 output areas in England and Wales, or the American Community Survey's census tracts in the United States, are found the same way.
It is the context that turns a map of your own data into an answer: how many people live near each of your sites, where the people who match your customers live, where a measure is highest or lowest. The asks on this page are examples of the kind of thing to say.
- Who can use it
- Free, Creator and Creator Max
- You provide
- A measure and a place
- You get
- A dataset of areas with the published figures, or the answer to your question
Ask for a measure and a place
Name the measure in your own words ("people aged 18 to 24", "household income", "homes that are rented") and the place. Add the country when the name is shared.
The place comes first. Mapstack finds the outline of the place you named, then gets the figures for every area inside it. If more than one place has the name, it lists them and you choose.
Finding the measure is a reading, not a word match. Statistics offices word their tables their own way ("total usual residents", not "population"), and several tables can look alike. So Mapstack works down the country's catalogue of topics to the table that holds your measure and reads what each candidate counts. Like a person doing the same search, it can pick a near neighbour. Each column it gives you names the statistic, what it counts and the period it refers to: read them before you rely on the figures.
It asks before it uses a stand-in. If the only way to answer is something other than what you asked for (a related measure, another level or year, age or income bands that do not match yours, or figures for only part of the place), Mapstack asks first. Nothing is made until you choose.
For example, asked what share of Liverpool's residents live within a 400 m walk of a bus stop, Mapstack fetched Census 2021 population for the city's 1,624 output areas without being told where to find it, named the release and year, and used it in the analysis.
Getting statistics uses part of your allowance. See Your allowance.
Get a measure for a place
How many people aged 18 to 24 live in each part of Leeds, UK?
Get household income by census tract for Denver, Colorado
Choose the level and the year
Levels run from regions down to neighbourhoods, and the ones on offer differ from country to country. Name a level ("by county", "census tracts", "output areas") or a year if you have one in mind, or say what the map is for and let Mapstack choose.
The levels are not only the administrative ones. In the United States you can ask for ZIP code areas (the Census Bureau's ZIP Code Tabulation Areas) and for census blocks, the smallest level published, as well as tracts and counties.
It will build a figure the office does not publish. Where you need a benchmark for an area that is not a published one (a metro area made of four counties), Mapstack fetches the counties' own figures, weights them (by the number of families in each, where the figure is a family income) and says how it arrived at the number, so you can put it in a method note.
A country can have more than one statistics body, and Mapstack goes to the one that holds what you asked for: a nation's own records office within a larger state, as readily as the central office.
Which levels exist depends on the release. A head count from the ten-yearly census goes down further than a survey's estimates do, so a level held for one is not always held for the other. Where the level you named is not in the release that answers your question, Mapstack says so and offers the levels that are, with how many areas each would give you, before it fetches anything.
Name the level or the year
A level or year you name is a requirement. Mapstack uses another only after you agree.
Get Census 2021 population for Liverpool by output area
Say what the map is for, and let Mapstack pick the level
With no level named, Mapstack picks one to suit the purpose: areas people know by name when you are choosing between places, smaller areas when you want to see a pattern.
Show me where families with young children live in Bristol, UK. It is to choose where to open a nursery
Read the figures
You get a dataset of the areas inside the place you named, at the level you asked for or the one Mapstack chose. Each column is one statistic with its unit and reference period. The dataset is yours to map, join to your own areas, or analyse.
A question gets an answer. Ask a question of the figures, such as "What is the working-age population of each local authority in Wales?" or "Which region of New Zealand has the highest share of people aged 65 and over?", and Mapstack works the answer out from them and gives it to you in the conversation. The figures it used stay out of your session and your Library. To look at them, map them or keep them, ask: Mapstack brings them in as a dataset.
The figures are the office's own. Every column is as the statistics office released it. When the office publishes no ready-made rate or share, you get the counts it is made from, and Mapstack names which to divide by which.
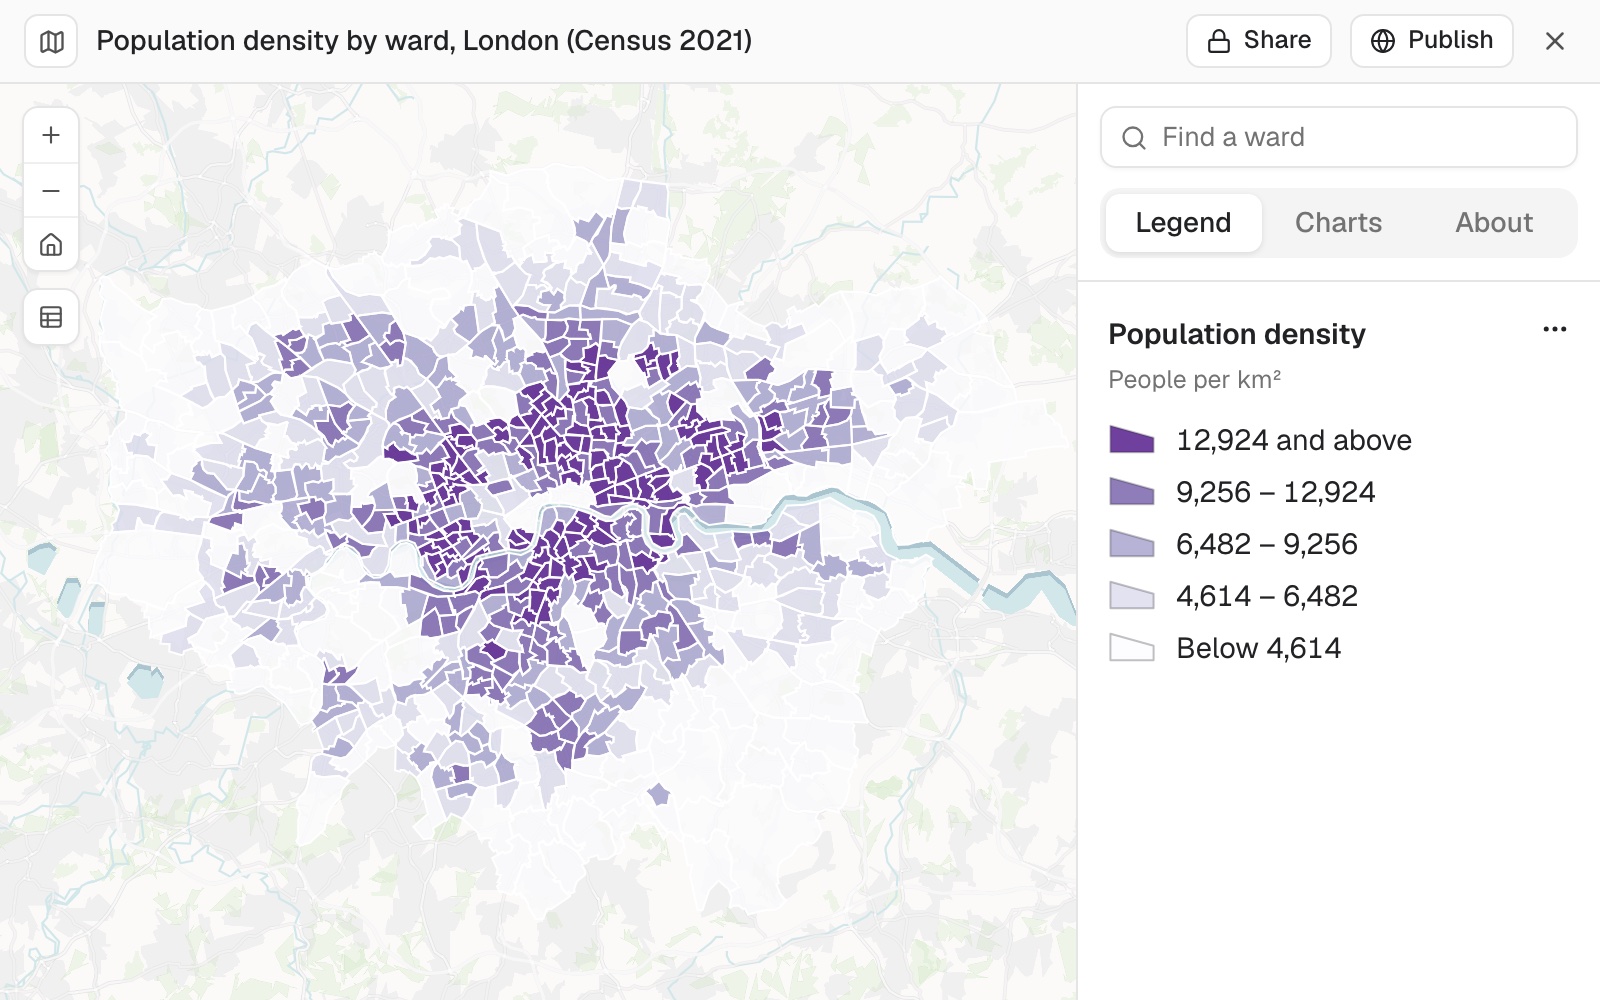 Example: Census 2021 population density for London's 680 ward areas, as the ONS published it in table TS006 (people per square kilometre), mapped in five quantile classes from below 4,614 to 12,924 and above.
It tells you what kind of figures they are. A full count (a census, which counts everyone) or a sample survey (estimates from a share of people, with sampling error). It names the release, the year and the level, and lists the limitations you need to know.
Countries and measures covered
Coverage depends on what each country's statistics office publishes. Mapstack reads what it holds from the current data when you ask, so ask it.
When a country or measure is not held, Mapstack says so and makes nothing; for a country, it lists the ones it holds. A published file of the figures may still be found by a search: see Data Mapstack can find for you. Or attach your own table of areas: see Map a spreadsheet.
Ask what is held before you ask for data
Which countries do you have census data for?
What area levels do you have for Canada?
Reference
| Coverage | Official statistics for most of Europe and North America, Australia and New Zealand, and a selection of other countries, mostly from national censuses |
| Area levels | From regions down to neighbourhoods, depending on the country and the release. Postal and statistical areas too, such as US ZIP code areas and census blocks |
| Countries, releases, years and levels held | Read from the current data when you ask. Ask Mapstack which countries are covered, or what levels a country has |
| Place of one request | One city, county, state or country |
| Countries in one dataset | One. Ask for each country separately |
| Releases in one dataset | One |
When a level would give more areas than one dataset can hold, Mapstack offers coarser levels that fit: see Sizes and limits.
What it can't do
- Make figures for a country whose statistics it does not hold. It says so and lists the countries it does.
- Start a request from a Viewer seat.
Common questions
I asked for population. Why is the column called something else?
It carries the office's own name for the statistic, such as "total usual residents", so you can trace it to the published table.
How do I know it's the measure I asked for?
Read each column's description: it names the statistic, what it counts and the period it refers to. If a column is not quite what you meant, ask again, saying exactly what should be counted and for whom.
Which census year is it?
Mapstack names the release and the year with the dataset. Boundaries are redrawn between censuses, and the figures belong to the areas of their own year. To hold it to a year, name it: "Get Census 2021 population for Liverpool by output area".
Can I get the figures for my own areas or catchments?
Yes. Ask for the figures to be added to your areas, rings or catchments. See Count and summarise by area.
Can I get the boundaries without the figures?
Yes, ask for them as a dataset: "Find the electoral ward boundaries for Birmingham, UK". See Data Mapstack can find for you.