

Keep a register of your assets on a map, tag them by area and pull out what someone needs
Turn an asset survey into a register on a map, mark the records inside an area, and pull out a list for a contractor.
Best for
Anyone who looks after things spread over a place: trees, streetlights, signs, bins, hydrants, benches. You end up with one register on a map, a record per asset, coloured by condition; a column set on exactly the records inside an area, with a count and the rule used; and a list of the records someone else needs, with a map of what was picked.
The example in this guide is a real survey: the City of Melbourne's open data of street and park trees ("Trees, with species and dimensions (Urban Forest)"), cut to the suburb of Carlton. It holds 4,368 trees, 3,180 in streets and 1,188 in parks, each with an ID, common and scientific name, genus and family, trunk diameter, year and date planted, age class (mature, semi-mature, unestablished), useful life expectancy, whether it is in a street or a park, and its latitude and longitude. Every ask below was sent with that file.
What you need
- The survey or asset list, as a spreadsheet with latitude and longitude or an address on each row, or as a GIS file.
- A Free, Creator or Creator Max seat.
Before you start
- Very large registers: see Sizes and limits.
- Updates come as edits or files. Change records by asking or in the dataset editor, or attach a newer survey. Every change is saved as a new version. Mapstack does not collect updates from the field.
- Areas are found by name, or attached. A park, street or district named in an ask is looked up; for a works area of your own, attach its outline.
The prompt
This is our street and park tree survey for Carlton. Set it up as our tree register on a map: one record per tree, coloured by useful life expectancy, with species, trunk diameter, age and year planted in the pop-up. Tell me what's missing from the survey.
What to expect
Mapstack makes the register
Your rows become a dataset, one record per tree, placed from their latitude and longitude. The map colours each tree by useful life expectancy, with the common and scientific name, trunk diameter, age class, year planted and life expectancy in the pop-up, a search box for tree names, a table and a chart by life expectancy class.
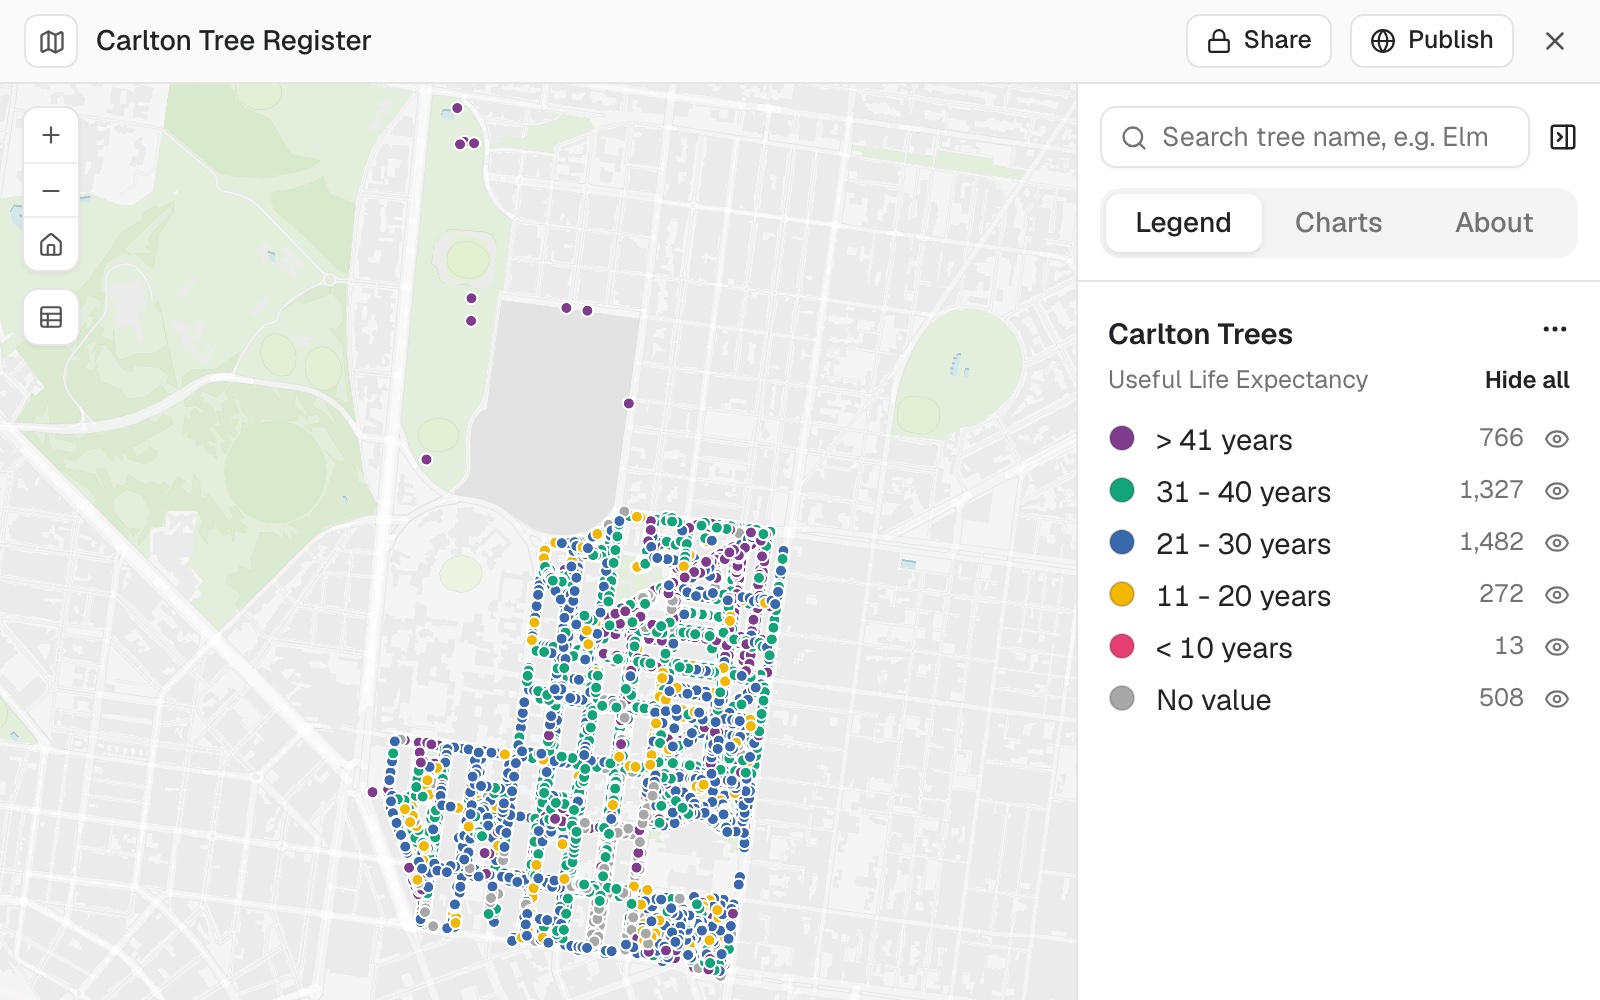 Example: the Carlton register, 4,368 trees coloured by useful life expectancy, with the count in each class.
It tells you where the survey has gaps
Mapstack counted the gaps field by field. In the example, 1,732 trees carried a planting date of 1 January 1900, a stand-in for "unknown"; 1,185 had no trunk diameter; 508 had no life expectancy (grey on the map, as No value); one had no common name. Those counts agree with the file. It then listed, from its own general knowledge and labelled as such, what tree registers often hold that this one does not: height and canopy spread, health, structural defects, maintenance needs, a risk score.
Read a placeholder value as missing. A date of 1900 is a gap, not an old tree.
You mark the records inside an area
Mark every tree inside Argyle Square as 'Argyle Square renewal 2027' in a new works column, and tell me how many you changed.
Mapstack added the column, set it on 92 trees and left the other 4,276 blank. The change was saved as a new version of the dataset, and the map shows it.
Ask what the edge rule was. The survey has no park name column, so Mapstack chose a rule itself. Asked, it said it used a rectangle round the square between its four streets and kept only trees recorded as in a park, leaving out 13 street trees on the kerbs round it, and offered to add them. A rectangle and the square's true outline differ at the corners: drawn against the square's outline from OpenStreetMap, the same file has 94 park trees inside. Say which rule you want ("inside the park outline, park and street trees") and the count follows it.
You pull out what someone needs
The contractor needs every street tree within 15 metres of Lygon Street with less than 10 years' life left. Give me that as a list I can send them, with a map of what you selected.
Mapstack drew a 15-metre corridor along Lygon Street and found 81 street trees in it, with their distance to the street. None had less than 10 years' life left; the whole survey has only 13. It said so rather than sending an empty list, and offered the two trees with 11 to 20 years left instead. The 81 trees came back as their own dataset and a corridor map, ready to download.
An empty result is an answer. Check it against what you know (here, how few trees are in that class at all) before widening the rule.
A register of lines or plots works the same way
The assets do not have to be points. Attach the GIS file that holds the lines or the outlines, and the register is built on those.
A network. A city's water mains, 16,214 stretches of pipe, become a register with one record for each stretch, coloured by owner, with a search by main ID and the length totalled by owner. More in Work with lines, routes and tracks.
Plots with records of their own. A register often lives in two places: the plots in a GIS file and the records in a database. Give Mapstack both and the column that links them. For Picton Cemetery, from Marlborough District Council's open data in New Zealand, 3,160 burial records were linked to 3,013 plots by the plot key, with none left over.
Link the burial records to the plots by the plot key. Make one map with every plot coloured by whether it has a burial recorded, with everyone buried in a plot listed in its pop-up, and a search by surname. Leave the funeral director and warrant number out of the pop-ups.
One plot can hold several records, and its pop-up lists them all. The map showed 2,096 plots with a burial and 917 with none, and a surname search finds every plot that holds it.
Make it your own
How many plots have nobody recorded, and were any records left without a plot?
How did you decide which trees are inside Argyle Square? What boundary did you use, and did any street trees on its edge count?
How many London Planes and English Elms do we have, by age class?
Common questions
How does it decide which records are inside an area?
By an edge rule: a box or the true outline, inside or touching, and which kinds of record. Left open, Mapstack chooses one, so ask "What rule did you use for the edge?" and then say the one you want, for example "inside the park outline, park and street trees", or attach the outline.
What if a selection comes back empty?
Nothing matched every condition, and that is an answer. Ask how many records match each condition on its own to see which one rules everything out, and check that against what you know before you widen the rule.
What about blanks and placeholder values in the survey?
Records with no value in the column the map is coloured by show grey, as No value; filter for them in the table, or ask where they are. Read a placeholder, such as a planting date of 1 January 1900, as missing: ask Mapstack to clear those values, or clear them in the dataset editor.
Can I undo a change to the register?
Yes. Every change to the register, and to its map, is saved as a new version, so you can bring an earlier one back with Version at the top. See Dataset versions and Go back to an earlier version of a map.
How do I keep the register up to date?
Change records by asking or in the dataset editor, or attach a newer survey. Every change is saved as a new version. Mapstack does not collect updates from the field.