

Find patterns, hot spots and clusters
See where points concentrate, test which concentrations are more than chance, find places that break the pattern, and predict values between samples.
When a list has thousands of points, the dots pile on top of each other and the pattern disappears. Mapstack reads the pattern for you, from a picture of where things concentrate to a statistical test of whether a concentration is real. Each result comes back as a dataset you can map, and ask questions of, like any other.
People use it to put limited effort where the problem is: patrols where burglaries concentrate, prevention visits where fire calls cluster, a pocket of deprivation that area averages hide, one store far below the stores around it, retail clusters, air quality across a city from sensors, contamination across a site from borehole results. The asks below are examples of the kind of thing to say. Use your own dataset and column names.
- Who can use it
- Free, Creator and Creator Max. A Viewer can ask for hot spots, outliers and clusters as an answer in the chat.
- You provide
- Points, or points or areas with a numeric column
- You get
- A surface, or your places marked by the pattern they are part of
Pick the method for your question
Each question has its own method:
| Your question | Ask for |
|---|---|
| Where do most of them happen? | A density surface (kernel density) |
| Is this concentration more than chance? | Hot spots and cold spots (Getis-Ord Gi*) |
| Which places are out of step with those around them? | Outliers (Anselin Local Moran's I) |
| What are the groups, and which points stand alone? | Point clusters (DBSCAN, HDBSCAN or OPTICS) |
| What is the value between my readings? | Interpolation (ordinary kriging) |
The scale changes the story. The density radius, the cell size and neighbour distance of a hot-spot test, and the distance and fewest points of a cluster search all set it. Leave them open and Mapstack chooses, and says what it used. When the result will be used to decide something, choose on purpose and write it on the map.
It asks when the column is unclear. If two columns could be the one you mean, or the data lacks the measure you asked for, Mapstack stops and asks rather than picking one.
It says what it did. The reply sets out the steps it ran and the choices it made, such as the column, the method and the scale, with any caveats about the data.
Density surfaces
Give it a dataset of points, and a weight column if each point stands for more than one thing. You get a new dataset of areas banded from least to most dense.
The same points can look like one broad blob or a dozen sharp peaks, depending on the radius. A dense band shows where points are close together, not that there are more than chance would give: for that, ask for hot spots.
Draw a density surface: where points concentrate
Mapstack spreads each point over a circle around it and adds the circles up, so the surface is highest where points are closest together. GIS people call it kernel density. The surface comes back as areas, one or more for each band of density.
Draw a density surface of the burglaries in this dataset, as incidents per square kilometre
Choose the radius and the bands
The radius is how far each point spreads. A larger one gives a smoother, broader picture; a smaller one shows local peaks.
Show where our customers concentrate, using a 2 km radius and five bands
Weight each point
When each point stands for more than one thing, such as a count of households, name that column. Each point then counts that many times.
Make a density surface of these survey points, weighted by the households column
Hot spots and cold spots
Give it points to count, such as incidents, or points or areas with a numeric column, such as sales or a rate. You get the cells, areas or features tested, each marked hot spot, cold spot or not significant.
"Hot spot" means the test. Mapstack uses the word only for the result of a hot-spot analysis.
Counts follow people. Busy places look busy on any map, and customers usually live where people live. A rate (per head, per household) is often the more honest view: name the column to divide by.
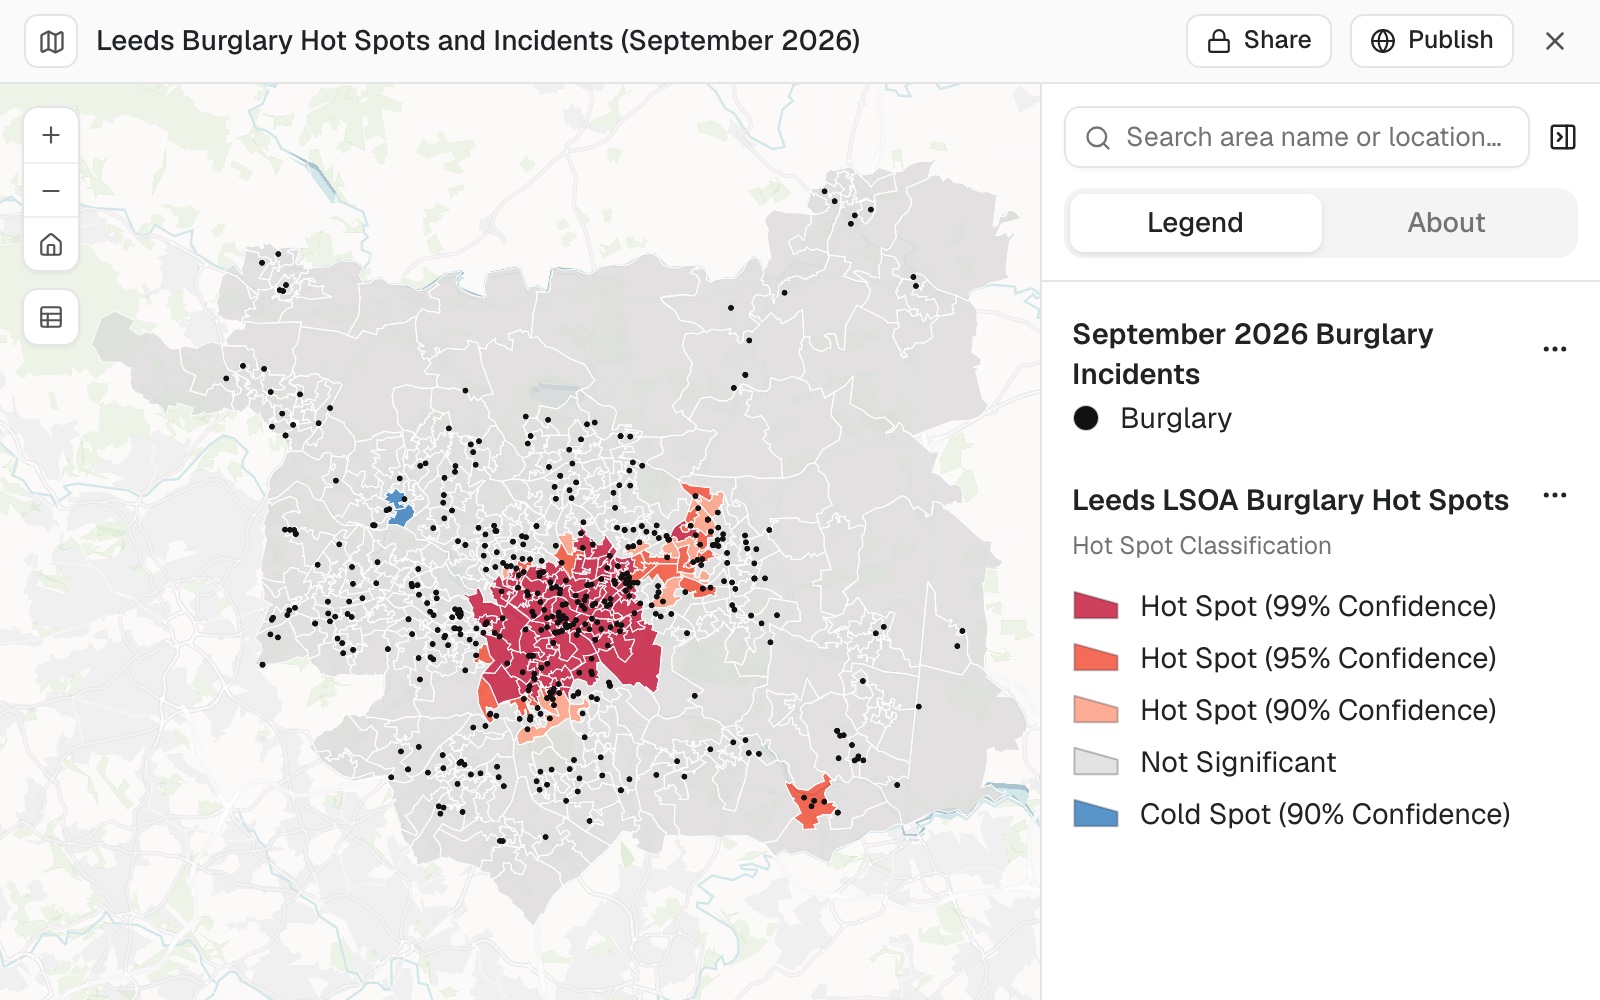 Example: burglary hot and cold spots across Leeds's 488 LSOAs in September 2026, tested on burglaries per 1,000 households: 105 hot spots at 90% confidence or more, most around the city centre, and 2 cold spots in blue. The 508 burglaries are the small black points.
Worked through in the guide Find hot spots.
Find hot spots and cold spots in a set of incidents
A hot spot is where high values sit together more than chance would explain; a cold spot is the same for low values. Mapstack tests each place against its neighbours (GIS people know the method as Getis-Ord Gi*). Give it points and it counts them into grid cells, then tests the cells.
Where are the hot spots of burglaries in this incidents dataset?
Test a rate, not a raw count
Name the column to divide by, such as population, so a town centre is not flagged just for having more people in it. If you have no population figures, Mapstack can fetch census figures for your areas first: see Data Mapstack can find for you.
Find hot and cold spots of sales per head across these postcode areas, dividing sales by population
Set the scale of the test
The size of the grid cells, and how far each place looks for neighbours, decide what counts as "together". If you have a scale in mind, say it.
Find hot spots of ambulance call-outs using 250 m grid cells, looking for neighbours within 1 km
Outliers
Give it the same as for hot spots. You get the features tested, each marked high-high, low-low, high-low, low-high or not significant.
Outliers repeat exactly. A feature is marked only when it is significant at 95% confidence, after a correction for testing many features at once (Benjamini-Hochberg false discovery rate). The test shuffles values to judge significance from a fixed starting point, so the same data gives the same marks unless you ask for a different random start.
Find places that stand out from their neighbours: outliers
A spatial outlier is a place whose value is out of step with the places around it. Mapstack compares every feature with its neighbours (Anselin Local Moran's I) and marks four kinds of result: high among high and low among low (clusters), and high among low and low among high (outliers). So it finds where values group and the exceptions inside them.
Which neighbourhoods have a low median income but are surrounded by affluent ones?
Find the outliers in burglary rate across these census tracts
Point clusters
Give it a dataset of points. You get your points with their own columns and a cluster number in CLUSTER_ID: 1 is the largest cluster, 2 the next, and -1 is noise. The distance and the fewest points decide the clusters.
| Clustering method | How it finds groups |
|---|---|
| DBSCAN (default) | A point is in a cluster when enough points lie within one distance of it. Every cluster is held to the same closeness |
| HDBSCAN | Each cluster finds its own closeness. Takes no distance |
| OPTICS | Orders points by how close each is to the next and starts a cluster at each sharp drop. Has a sensitivity setting, 0.001 to 0.999 (0.05 if you don't say) |
Group points into clusters
Each point gets the number of its cluster, and points in no group are marked as noise. Say the fewest points you would call a cluster, and how close they must be: these two numbers decide the result more than anything else. Mapstack uses DBSCAN unless you ask for another method.
Group these cafés into clusters of at least 5 that are within 300 m of each other
Find groups of different density
With HDBSCAN each cluster finds its own closeness, so a tight group in a town centre and a loose one in the suburbs can both be found. It takes no distance.
Cluster these wildlife sightings with HDBSCAN, at least 10 points per cluster
Predict values between samples
Interpolation predicts a measured value. Give it points with a numeric column measured at each one, such as a sensor reading or a sale price. For how many points there are in a place, ask for a density surface.
You get a new dataset of areas, each a class of the predicted value, with the prediction error.
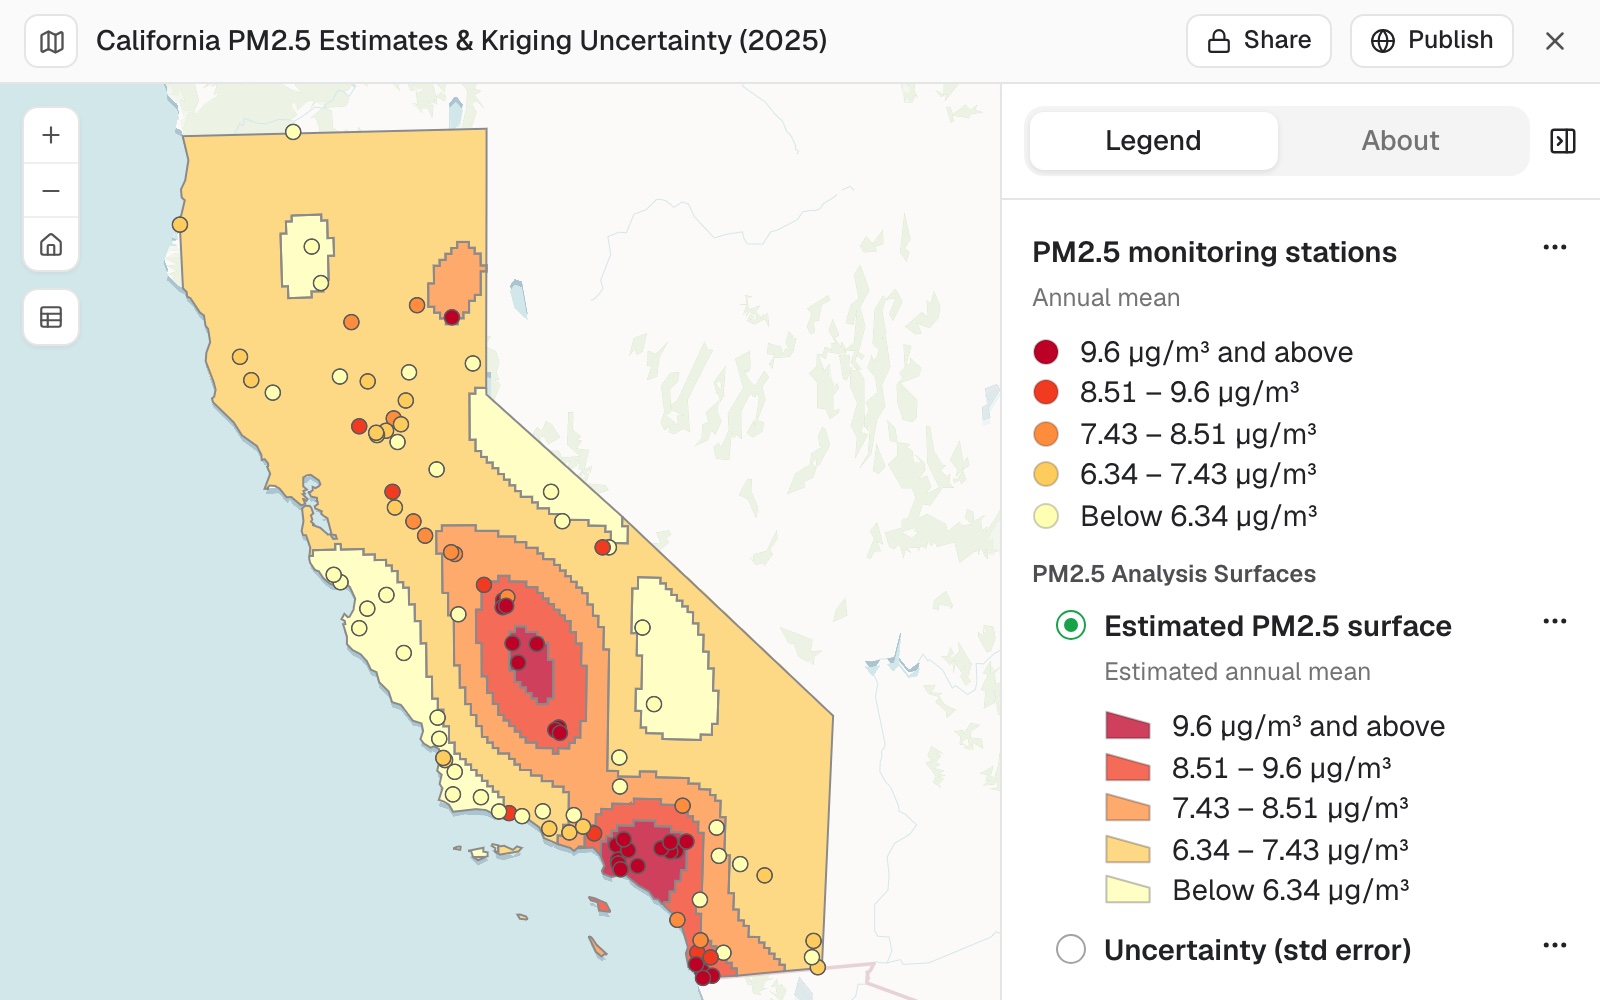 Example: the 2025 annual mean PM2.5 estimated across California from 101 monitors, in five bands from below 6.34 to 9.6 µg/m³ and above, highest in the Central Valley and around Los Angeles. Each monitor is coloured by its own reading on the same scale, and the prediction error is the second surface in the legend.
Worked through in the guide A surface from sample points.
Predict values between sample points: interpolation
You measured something at a handful of places (sensors, boreholes, gauges, sales) and want to know what it is like in between. Say which column was measured. Mapstack predicts that value across the ground with ordinary kriging, which also estimates how uncertain each prediction is.
Interpolate PM2.5 across the city from these air quality sensor readings
Choose how fine the surface is and how many classes
Make a house price surface from these sales, in 8 classes on a 250 m grid
See where the prediction is weak
The prediction error is high where samples are far apart and low near them. Mapping it beside the surface shows which parts to trust.
Include the prediction error, and map it next to the surface so I can see where the estimate is weakest
Map and keep the results
A density surface or an interpolation is a new dataset, in the session and your Library. Hot spots, outliers and clusters come back as an answer in the chat, and as a new dataset when you ask to keep it: see Ask questions about your data.
Surfaces are areas (polygons), not imagery, so you can count what falls in them or put them beside other data. Your own data is not changed. Make a map of any of them by asking.
A Viewer gets an answer. On a Viewer seat, hot spots, outliers and clusters come back in the chat, not as a new dataset.
Put the result on a map
Map the hot and cold spots, hot in red and cold in blue
Map the clusters and outliers of store revenue, with the high-among-low stores in red
Map the clusters, each in its own colour, with the noise points in grey
Reference
| Analysis | Method | Takes | Needs at least |
|---|---|---|---|
| Density surface | Kernel density | Points | 2 points |
| Hot spots | Getis-Ord Gi* | Points to count, or points or areas with a numeric column | 30 features (60 points when points are counted) |
| Outliers | Anselin Local Moran's I | As hot spots | 30 features |
| Point clusters | DBSCAN, HDBSCAN or OPTICS | Points | The fewest points per cluster you set, 2 or more |
| Interpolation | Ordinary kriging | Points with a measured value | 10 points with a value, and at most 5,000 samples |
| Analysis | What you can set |
|---|---|
| Density surface | The radius (chosen for you if you don't say), the number of bands (up to 32), the density unit (per square kilometre unless you say otherwise), a weight column. Worked out on a mesh of at most 300 by 300 cells |
| Hot spots | The column to test, a column to divide by, the grid cell shape and size, the neighbour distance |
| Outliers | The column to test, the number of permutations, the random start |
| Point clusters | The method, the fewest points, the distance (DBSCAN and OPTICS; worked out from the data if you don't say) |
| Interpolation | The column, the number of classes (up to 32), the grid cell size, whether to include the prediction error |
Distances are in metres unless you say otherwise.
Hot-spot results carry, for each area or cell, its z-score, its p-value and its confidence level: 90, 95 or 99%.
What it can't do
- Make an image or a raster. Every surface is a dataset of areas.
- Work from imagery. Analysis works on datasets; an elevation image or other imagery is for display. See Put aerial, satellite or elevation imagery on a map.
- Draw a density surface or clusters from lines or areas. They take points.
- Test hot spots or outliers on fewer than 30 features, or interpolate from fewer than 10 samples with a value or more than 5,000.
- Draw a density surface or interpolate on a Viewer seat.
Common questions
Is a heat map the same as a hot-spot map?
No. A heat map is a way of drawing points so dense areas glow, and a map can show one without making a new dataset: see Make a map. A hot-spot analysis tests whether a concentration is more than chance. Ask for the one you need.
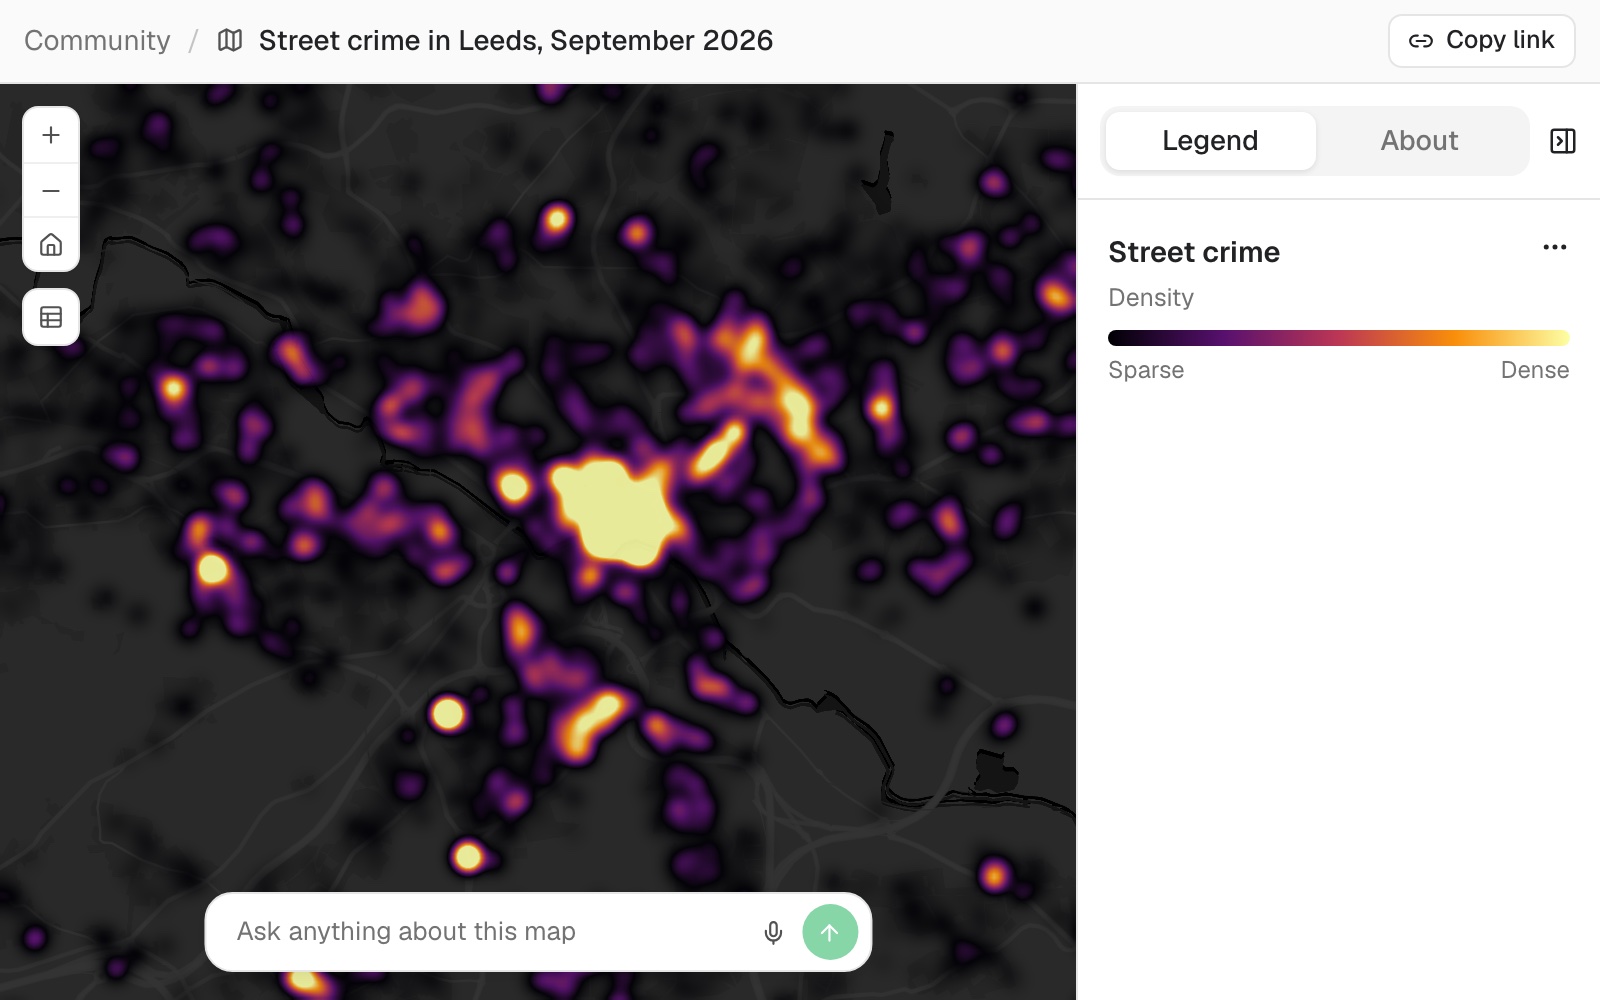 Example: the 16,962 street crimes recorded in and around Leeds in September 2026, drawn as a heat map, brightest in the city centre.
How do I stop the busiest places coming out hot just for being busy?
Test a rate, not a count, by naming the column to divide by: 'Test sales per head, dividing sales by population'. Places with more people have more of everything.
How do I choose the scale?
Larger for a broader picture, smaller for local detail: a larger density radius or cluster distance joins things together, a smaller one splits them apart. Say it outright ('use a 2 km radius') and write it on the map. For clusters, naming all three settings ('DBSCAN, at least 5 within 300 m') gives the same clusters each time.
Which parts of an interpolated surface can I trust?
The parts near your samples. Ask for the prediction error beside the surface: 'Map the prediction error next to the surface'. Where it is high, samples are far apart.
How do I check a hot spot or an outlier?
Read the column and the scale in the reply: they are what was tested. Then pick the strongest result and ask for its value and its neighbours' values, as you would with a colleague's work. A high-low outlier should stand clearly above the places around it.