

Find what share of residents can walk to a bus stop, area by area
Count bus stops per area, work out who lives within a short walk of one, and turn the result into a report, a print and an app.
Best for
Anyone who has to show how well a service reaches people, area by area: transport and planning officers, public health teams, consultants preparing evidence. You end up with the share of residents in each area within a set walk of a stop, the method written down, and the same result as a report, a print for a committee pack and a small app for colleagues.
The example in this guide is real public data for Liverpool: the Department for Transport's NaPTAN export of bus stops for Merseyside (a CSV with coordinates) and the Office for National Statistics' May 2024 ward boundaries for Liverpool (GeoJSON). Every ask below was sent with those two files. The same steps work for clinics, schools, shops or any other set of places, and for any set of areas.
What you need
- The places, as a spreadsheet with coordinates or a GIS file.
- The areas you want results for, as a GIS file. If they are official boundaries, Mapstack can fetch them instead (see Get official boundaries).
- A Creator or Creator Max seat for the report, the print and the app. The counting, the walking analysis and the map work on any seat.
Before you start
- Say the method you want. The distance, whether it is a walk along paths or a straight line, and which population figures to use. Mapstack follows what you state and writes it down; anything you leave open, it decides and tells you.
- Large analyses are confirmed first. Before a long run, Mapstack tells you what share of your allowance it will use and waits for you to go ahead.
The prompt
Two files attached: the NaPTAN export for Merseyside and Liverpool's May 2024 ward boundaries (ONS, BGC). Keep only active bus stops (StopType BCT, Status active). Spatial join the stops to the wards, count stops per ward, and give me the table plus a choropleth of stops per ward, natural breaks, 5 classes. Tell me how many stops fell outside the 64 wards.
What to expect
Your files become datasets, and the stops are counted
Both files are kept as datasets you can open and check. Mapstack filters the stops as asked, counts them inside each ward and adds the count to the wards. It reports what fell outside: in the example, 7,079 active stops, 1,906 inside Liverpool's 64 wards and 5,173 elsewhere in Merseyside.
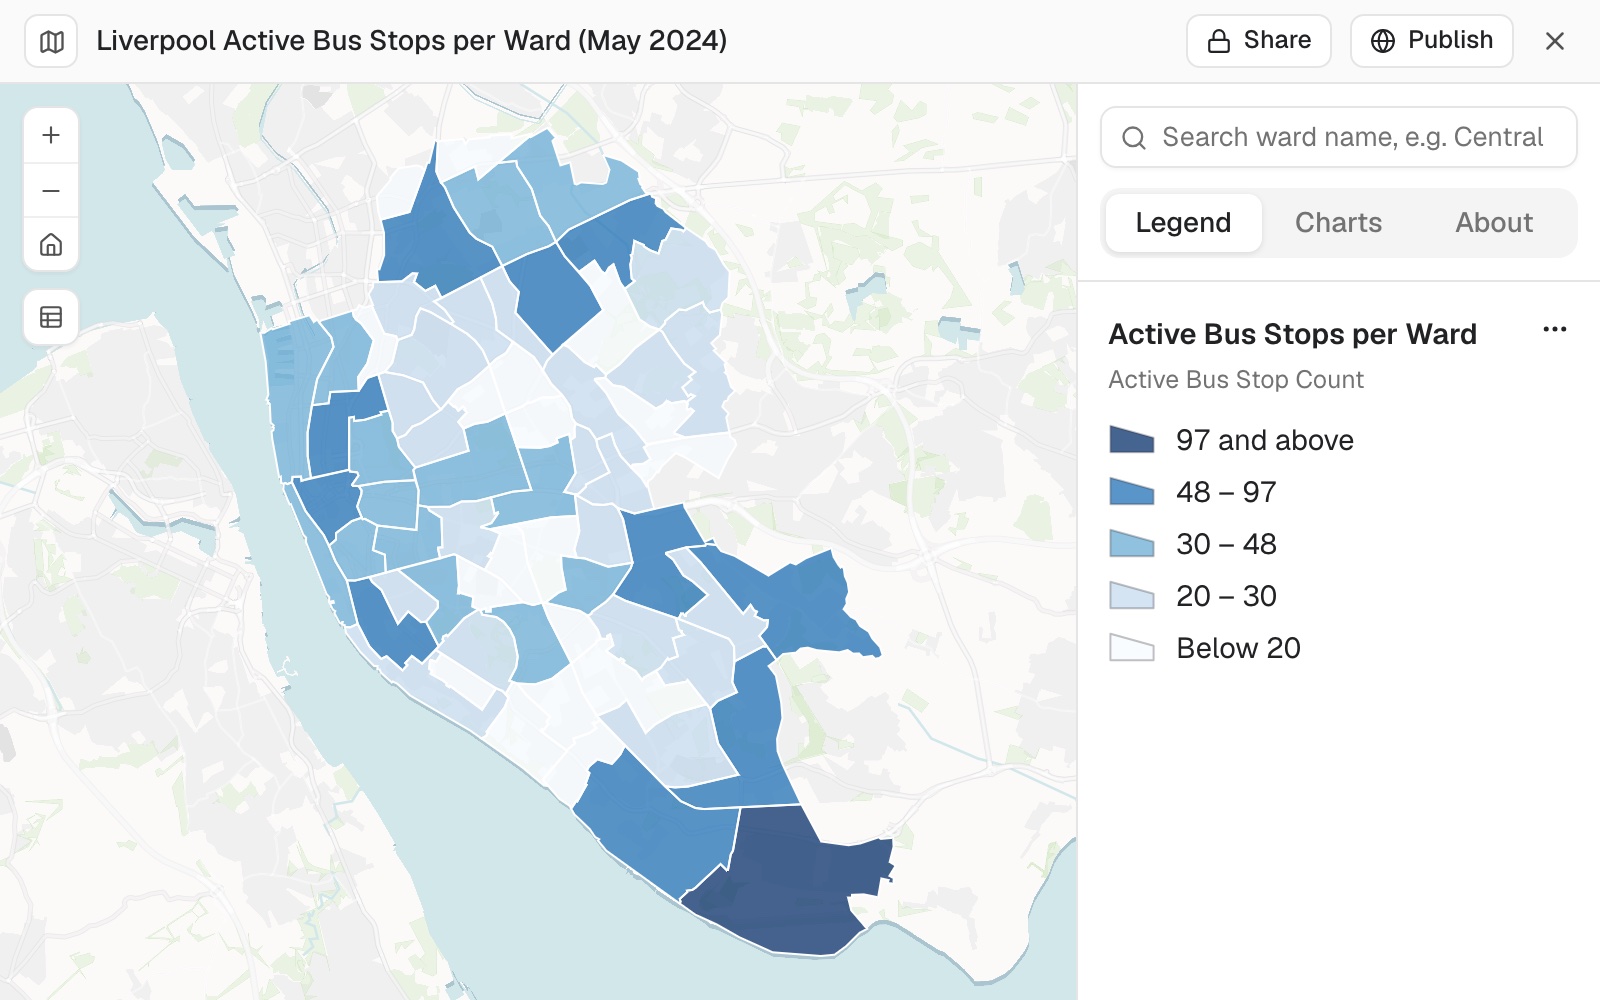 Example: active bus stops per ward in Liverpool, five classes by natural breaks: 1,906 stops, from 6 in the emptiest ward to 97 in the busiest.
You ask the real question: who can walk to a stop
A count of stops does not say who can reach one. Ask for the share of residents within a walk, and say how to measure it:
Next: what share of each ward's residents live within a 400 m walk of an active bus stop? Use Census 2021 population at output area level (OA centroids), walking network distance not straight line. Give the percentage by ward, the city-wide figure, and state the method, CRS and data vintages.
Mapstack fetches the census population itself, draws 400 m walking areas along paths around the stops, and gives the share for each ward and for the city. It writes out the method step by step, the coordinate system at each step and the date of every input, and says the judgement calls it made: in the example it kept stops just outside the city so that residents near the boundary were counted correctly.
You check it as you would a colleague’s work
Read the method and look at the lowest and highest areas. The result depends on the stop list and the path network being current, so the date of each input is part of the answer. In the example the report later pointed out that more stops does not mean better access: one ward with 97 stops had lower access than one with 6.
You turn it into what your audience needs
Each output is built from the same datasets, so the numbers agree everywhere.
Write this up as a report for the council's transport committee: the stop counts and the 400 m walk access by ward, with the map, the five lowest wards called out, and the method in an appendix.
Now a print for the committee pack: an A3 landscape GIS sheet of walk access by ward. Title block with figure number 1, revision 0 and today's date, scale bar and scale statement, north arrow, legend, ward labels, and a sources and copyright note.
The print is designed to the paper size and states its scale. If something you asked for would harm the page, Mapstack says so: in the example it left the 64 ward labels off because they would overlap, and said where the names can be read instead.
Make it your own
Build a small web app for council colleagues: search a ward by name or click the map, and see its stop count, residents, and the share within a 400 m walk, ranked against the city average.
Common questions
Where did a figure come from?
Ask: "Show me the rows and the steps behind Allerton's 57.85%." Mapstack shows its working for any figure, the way a colleague would.
Can I use a different distance, or straight-line distance?
Yes. Say the method in full, for example "Use 800 m along paths", and ask it to run again. Anything you leave open, Mapstack chooses and tells you which.
Why are some stops not counted?
Check the filter and the area: ask how many records were kept and why the rest were dropped. In the example 5,173 of the 7,079 active stops were elsewhere in Merseyside, outside Liverpool's wards.
Can it keep this up to date?
Yes. A routine can repeat the counts and the map on a schedule. An app changes only when you ask for it in a session. See Routines.