

Combine and reshape data
Join a table to shapes, stack two lists, cut one layer by another, keep what is inside an area, merge areas into regions or turn areas into points.
Data rarely arrives in the shape a question needs. The figures are in one table and the boundaries in another; the file covers the whole country and you want your patch; the wards are in the data and the report is by district. Mapstack joins, stacks, cuts, merges and converts datasets so they fit the question, and every result is a new dataset, with your originals left as they were.
People use it for census figures on ward boundaries, condition scores on assets, a file per year made into one, a national dataset cut down to a council area, how much of each parcel lies in a flood zone, land free of every restriction, wards merged into districts, and label points for districts. The asks below are examples of the kind of thing to say. Change the names to your own data.
- Who can use it
- Free, Creator and Creator Max. A Viewer can ask questions answered by a join, a clip or centroids, with the answer in the chat.
- You provide
- One or two datasets, and what you want from them
- You get
- A new dataset in the shape you need
Pick the job for your data
| You have | You want | Ask for |
|---|---|---|
| A table of figures, and shapes with the same codes | The figures on the shapes | A join by key |
| Records, and areas | The area each record is in | A join by location |
| Two lists of the same kind | One list | Stacking (merge or append) |
| A large dataset, and your area | Only what is inside it | A clip |
| Two layers that cross | Where they overlap, or do not | An overlay: intersect, union or erase |
| Small areas with a grouping code | Larger regions | A dissolve |
| Areas or lines | One point for each | Centroids |
Join two datasets
Give it two datasets in the session, in any mix of points, lines, areas or a plain table, and how they match: a relationship in space ("inside", "within 2 km", "touching"), a column they share, or both.
One side keeps its rows. The dataset you join onto keeps its records, and the other supplies columns. Say which is which if it is not obvious from your words. With one row per record, several matches are counted and summarised; with one row per match, each pairing is kept whole. The figures can also come as a table in the conversation.
A key join depends on the codes being written the same way. "00123" and "123" are different values, and a spreadsheet that dropped leading zeros has changed every code it touched. When few rows match, compare a few codes from each side first.
Ask how many matched nothing. It is the first check on any join. Asked when joining Merseyside's bus stops to Liverpool's 64 wards, Mapstack reported that 5,173 of the 7,079 stops fell outside every ward, which was right: the stops covered the whole county.
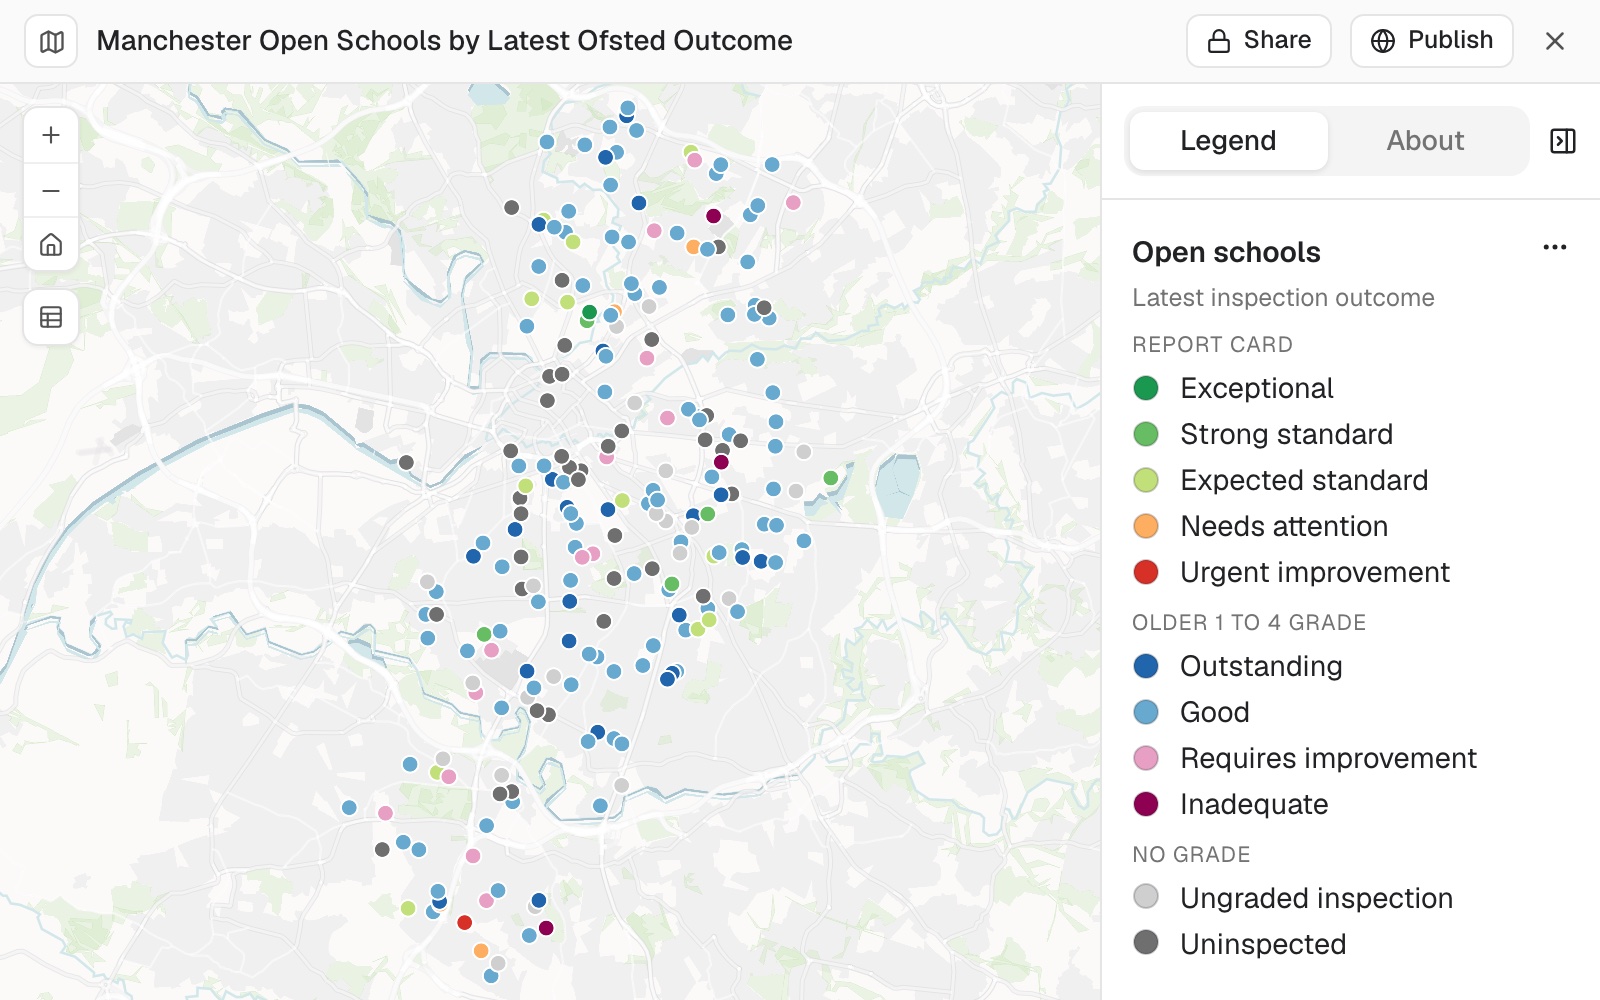 Example: Manchester's 222 open schools, coloured by their latest Ofsted outcome after the DfE register was joined to Ofsted's results on each school's reference number. The 38 in dark grey have no inspection result.
No shared code and no coordinates? It can match on the address itself. Where two tables have only addresses in common, Mapstack reads them as addresses rather than as text: it standardises the abbreviations and the unit numbering, matches a street number that falls inside a building's number range, and splits a record covering two units onto both. Every match it adjusted comes back with the reason, and so do the records with no match and the ones with more than one candidate.
A match can be one to many. A register with no locations of its own, joined onto plots or parcels, keeps one row per plot and lists every record that belongs to it (each person in a burial plot, each lease on a building) with a count, in the pop-up. Plots that matched nothing are kept and labelled, not dropped.
A match can turn on more than nearness. Within fifty metres and with overlapping dates and from different owners is one condition, not three asks. Where a file holds several rows per thing (one row per street segment of a permit), say what the thing is and Mapstack groups the rows before it pairs them.
Several layers in one ask. One register can take columns from several attached layers at once: the length of the rights of way inside each parcel, the names and references of the commons it overlaps, the tree-order numbers covering it, and a flag for whether any of them apply.
Worked through, with the match counts on each side, in the guide Join two tables.
Join a table to shapes on a shared code
An attribute join: the census table matches the ward boundaries on the ward code. Say which column holds the code on each side if the names differ.
Join the census table to the ward boundaries using the ward code
Add the area each record falls in
A spatial join: each record gets the columns of the area it sits in, so it can be counted or reported by area. You can match by location and by key together.
Add the district each school is in as a new column
Match two tables on their addresses
For two lists that share no code and have no coordinates. Mapstack reports each match it had to adjust, with the reason.
Match the deeds to the parcels on the address, including the unit numbers
Group records with a lookup of your own
Attach the lookup and name it. A reference table pasted into the conversation works the same way, including as the figures a calculation reads from.
Group these small areas into wards using the lookup table I attached
Use the yield table I pasted to work out a figure for each stand
Match on more than one condition
Name every condition in one ask. Where your file has several rows per thing, say what the thing is so they are grouped before pairing.
Find permits within 50 m of each other whose dates overlap and whose holders differ
Summarise what matches each record
You get one row for each record, with the number of matches and any totals or averages you ask for.
For each depot, how many stores are within 2 km, and what are their combined sales?
Keep one row for every match
A record with three matches then appears three times, once with each.
List every incident with the road it touches, one row per match
Keep the records that match nothing
Keep every school in the result, including any outside all the districts
Stack two lists into one
You get the rows of both in one dataset, columns matched.
Stack two lists into one: merge or append
Stacking puts the rows of one dataset under the rows of another. Both must hold the same kind of shape: points with points, areas with areas. Where columns are named differently, say which goes under which.
Combine the 2024 and 2025 store lists into one dataset
Merge the two councils' parcel files, putting OWNER_NAME under Owner
Combine the two site lists and drop the internal reference columns
Clip to an area
Give it the features, and an area: a dataset of one or more areas, or a place Mapstack can fetch the boundary for. You get the features inside the area, cut at the edge or whole.
Clips and overlays cut shapes; they add nothing from the area and count nothing. A clipped feature keeps its own columns: to tag each one with the area it is in, ask for a join.
Keep only what is inside an area: clip
Features that cross the edge can be cut at it, or kept whole. Say which. Name a place and Mapstack fetches its official boundary itself: see Data Mapstack can find for you.
Keep only the roads inside the city boundary, cut at the edge
Keep the stores within the region, whole
Keep only the parcels inside the Liverpool council area
Overlay two layers
Give it two datasets, and which of intersect, union or erase. You get the cut pieces. Each piece records its size (AnalysisArea), the size of the shape it came from (InputArea) and its share of that shape (PercentOfInput). To count or total what lies inside areas, see Count and summarise by area.
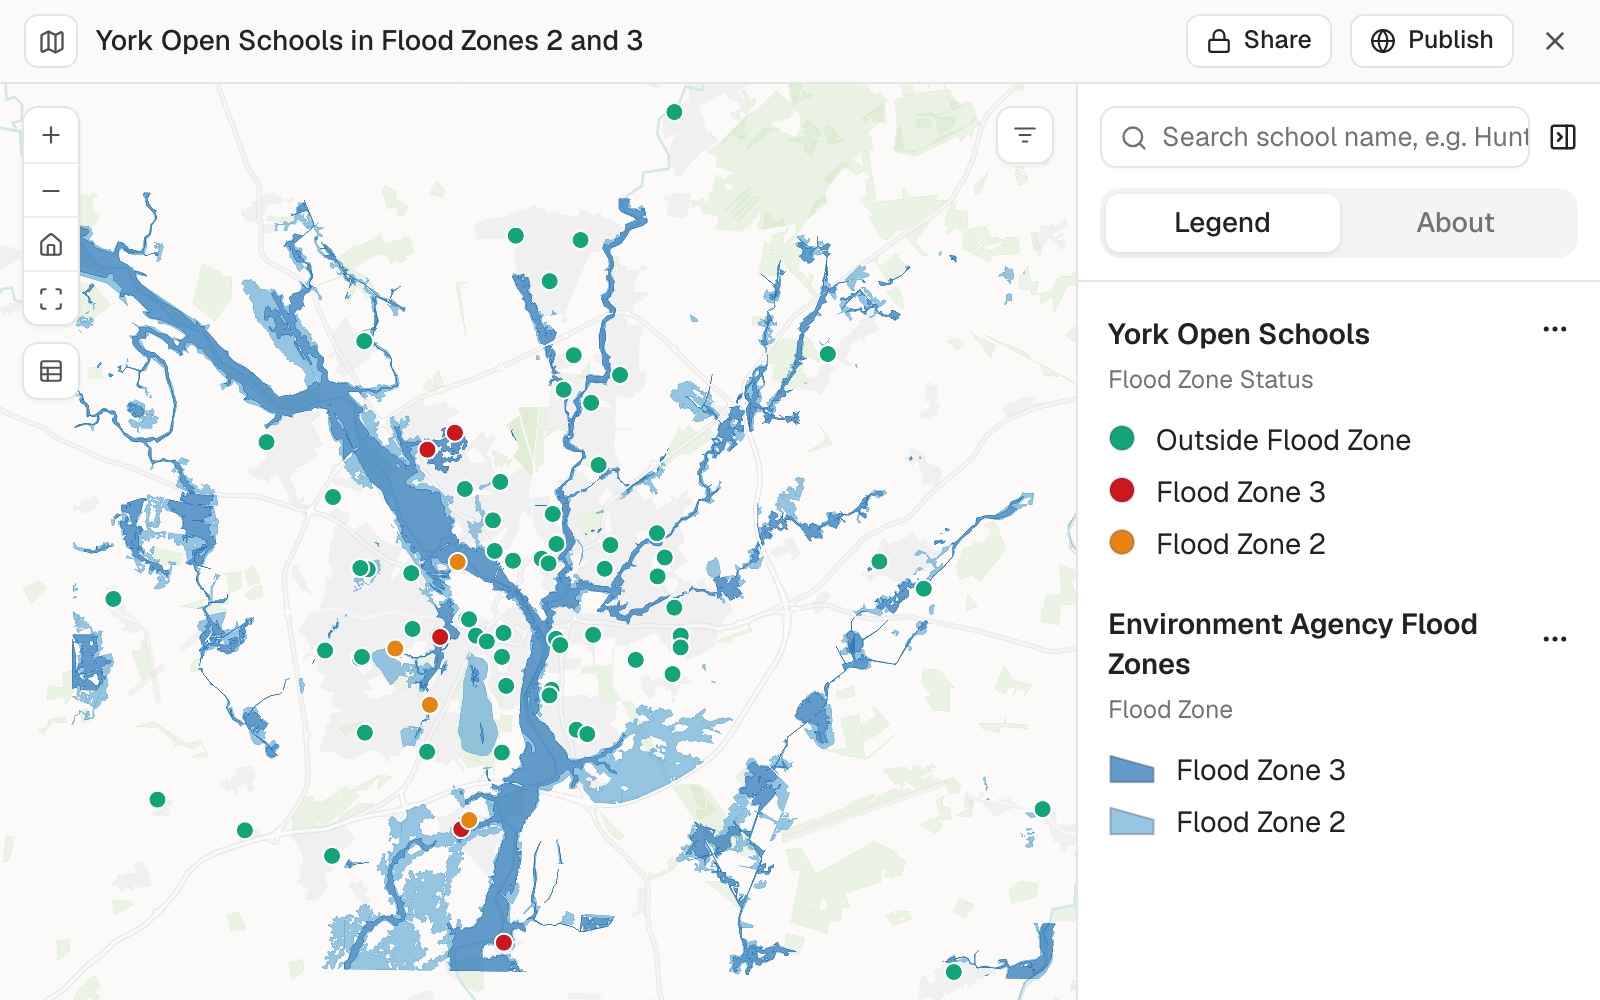 Example: York's 74 open schools over the Environment Agency's flood zones 2 and 3, each marked with the zone it falls in: 5 in zone 3 (red), 5 in zone 2 (orange) and 64 outside both (green).
Worked through in the guide Sites in flood zones.
A union of two large layers makes many pieces. Clip both to the area you need first, or intersect instead. Very large results: see Sizes and limits.
Keep only where two layers overlap: intersect
Show the land use within the flood zones
Find how much of each shape lies in another
Every cut piece carries its share of the shape it came from, so the answer comes out per feature: "40% of this parcel is in the flood zone".
What percentage of each parcel is inside the flood zone?
Remove what falls inside another layer: erase
Keep the parcels outside the protected areas, with the protected parts removed
Combine two layers into every piece of both: union
Each piece carries what it is in both layers, which shows where two zonings disagree.
Union the two zoning datasets so every piece shows both zones
Merge areas into regions
Give it a dataset of areas, and the column or columns to merge on if there are any. You get the merged regions, with their statistics.
A dissolve follows your data. Areas merge only where they share the value you name, or touch when you name none: Mapstack does not invent the groups. A region in several pieces, such as a district split by a river, can be one feature or one per piece. For regions with balanced totals, see Build territories and plan routes.
Merge areas into regions: dissolve
Areas that share a value in a column (wards with the same district code, parcels with the same owner) become one shape each. Name no column and the areas that touch or overlap are merged.
Merge these wards into districts using the district code column
Merge all the touching flood zones into one
Merge areas and total them
Say what to total or average for each region.
Dissolve the parcels by owner and total their area
Turn areas into points
Give it a dataset of areas or lines. You get one point for each.
A centroid stands in for the whole area. Everything in the area is treated as if it were at that one point. For small areas such as census output areas that is close enough; in a large rural area people may live a long way from its middle.
Turn areas or lines into points: centroids
The centre is the geometric middle. A point inside is sure to fall on the shape, which matters for a crescent, a ring or a winding river, whose centre can lie outside it, and for labels.
Make a point for each parcel so I can measure distances from them
Give me a label point for each district that falls inside the district
Use points for areas inside a bigger question
You do not have to make the points first. Say how the areas should be represented and Mapstack does the step itself. Asked who in Liverpool lives within a 400 m walk of a bus stop, Mapstack turned each of the city's 1,624 census output areas into a point and measured the walk from there.
Use output area centroids and walking network distance to work out what share of residents live within 400 m of a stop
Use the result
Every result is a new dataset, in the session and your Library. Your originals stay as they were. To change a dataset itself, see Edit your data and undo changes.
Make a map from it, ask questions of it, or download it: see Download and export.
A Viewer gets an answer. On a Viewer seat, joins, clips and centroids come back in the chat, not as a new dataset.
Reference
| Job | What you can ask for |
|---|---|
| Join by location | Inside, touching or overlapping, or within a distance you give (metres unless you say otherwise) |
| Join by key | One column on each side holding a shared code or name |
| Join rows | One per record with matches summarised, or one per match. Records with no match kept or left out |
| Stack | Which column of one goes under which of the other; columns to leave out |
| Clip | Cut features at the edge, or keep them whole |
| Overlay | Intersect (only where both overlap), union (every piece of both, each carrying both datasets' columns), or erase (the first dataset with the parts inside the second removed) |
| Dissolve | One or more columns to merge on; with none, areas that touch or overlap merge. One feature per region, or one per separate piece |
| Centroids | The centre, right for compact shapes; or a point inside, right for labels and odd shapes |
Joins and dissolves can report, per column: sum, mean, minimum, maximum, standard deviation, count, range and variance.
Very large results: see Sizes and limits.
What it can't do
- Stack points with areas, or other different kinds of shape.
- Clip or overlay imagery. Analysis works on datasets; imagery is for display.
Common questions
How do I get more rows to match on a code?
Compare the codes on each side: 'Show me a few values from each code column'. They often differ in case, spaces, leading zeros, or a number on one side and text on the other.
Can I keep one row for each record I started with?
Yes. Ask to keep every record, including those that match nothing, and for one row per record. With one row per match instead, a record with three matches appears three times.
How do I merge areas whose names are spelt slightly differently?
Tidy the values first. Ask 'List the distinct values in the district column', spot pairs such as 'North Ward' and 'North ward', make them the same, and merge again.
Is a centroid good enough to measure from?
For small areas such as census output areas, yes. In a large rural area people can live a long way from the middle, so use smaller areas there, or measure from the areas themselves where the question allows.
How do I check the result?
For a join, ask how many records matched nothing and whether that fits what you know. For a stack, the record count should be the two you started with added together. For an overlay, look at a feature you know: a parcel wholly inside the flood zone has the same AnalysisArea as InputArea.