

Check which of your sites sit in a flood zone
Overlay your list of sites on a hazard layer such as flood zones, flag the zone each site is in, and hand over a table and a map.
Best for
Anyone who has to say which of their sites sit in a hazard zone: estates and facilities teams, insurers and brokers, planners, consultants writing a risk assessment. You end up with every site flagged with the zone it is in, a table you can hand over, a plain answer for any single site, and a map.
The example in this guide uses two real public files. The first is the Department for Education's register of schools in York (Get Information About Schools, downloaded 11 November 2026): 178 establishments, 74 of them open, each with an address and a British National Grid easting and northing. The second is the Environment Agency's Flood Map for Planning, Flood Zones 2 and 3 (Rivers and Sea), for the York area, downloaded from the Defra Data Services Platform on 11 November 2026 as GeoJSON: 1,468 polygons, each marked FZ2 or FZ3. Zone 3 is land with the highest chance of flooding from rivers or the sea; zone 2 has a medium chance. The asks below were sent with those files. The same steps work for any list of sites and any layer of zones: landslide, subsidence, wildfire or a planning designation.
What you need
- Your sites, as a spreadsheet with coordinates or addresses, or a GIS file.
- The hazard zones as polygons in a GIS file (GeoJSON, GeoPackage or zipped shapefile), cut to your area. A national layer is very large, so download only the area your sites are in.
- A Free, Creator or Creator Max seat.
Before you start
- Repair the zones file first. Official zone files often carry a few invalid shapes, such as rings that cross themselves, so the example's Flood Map for Planning zones were repaired once before they were attached (in QGIS, Fix Geometries).
- Say which location to use. If your sites have coordinates, say what they are ("eastings and northings") so each site sits where it really is, not at its postcode.
- Say how to treat a site in two zones. "Worst zone wins" is the usual rule for a risk table; state it.
The prompt
These are our schools in York and the Environment Agency's flood zones 2 and 3. Which of our open schools are in a flood zone? Give me a list flagging each one with the zone it's in, and a map.
What to expect
Each file becomes a dataset
Mapstack reads the sites into a dataset, converting the eastings and northings on the way in, and reports what it could not place: in the example 162 of the 178 schools, with the 16 that had no location left off. The zones become a dataset of their own: in the example, 1,467 shapes.
It overlays the sites on the zones, and makes the map
An overlay tests which zone each site falls inside. Mapstack adds the zone to every site and counts the result: in the example 10 of the 74 open schools were in a flood zone, 5 in zone 3 and 5 in zone 2, and 64 outside both. The map shows the schools coloured by zone over the flood zones themselves, with a search by school name and filters by zone and phase.
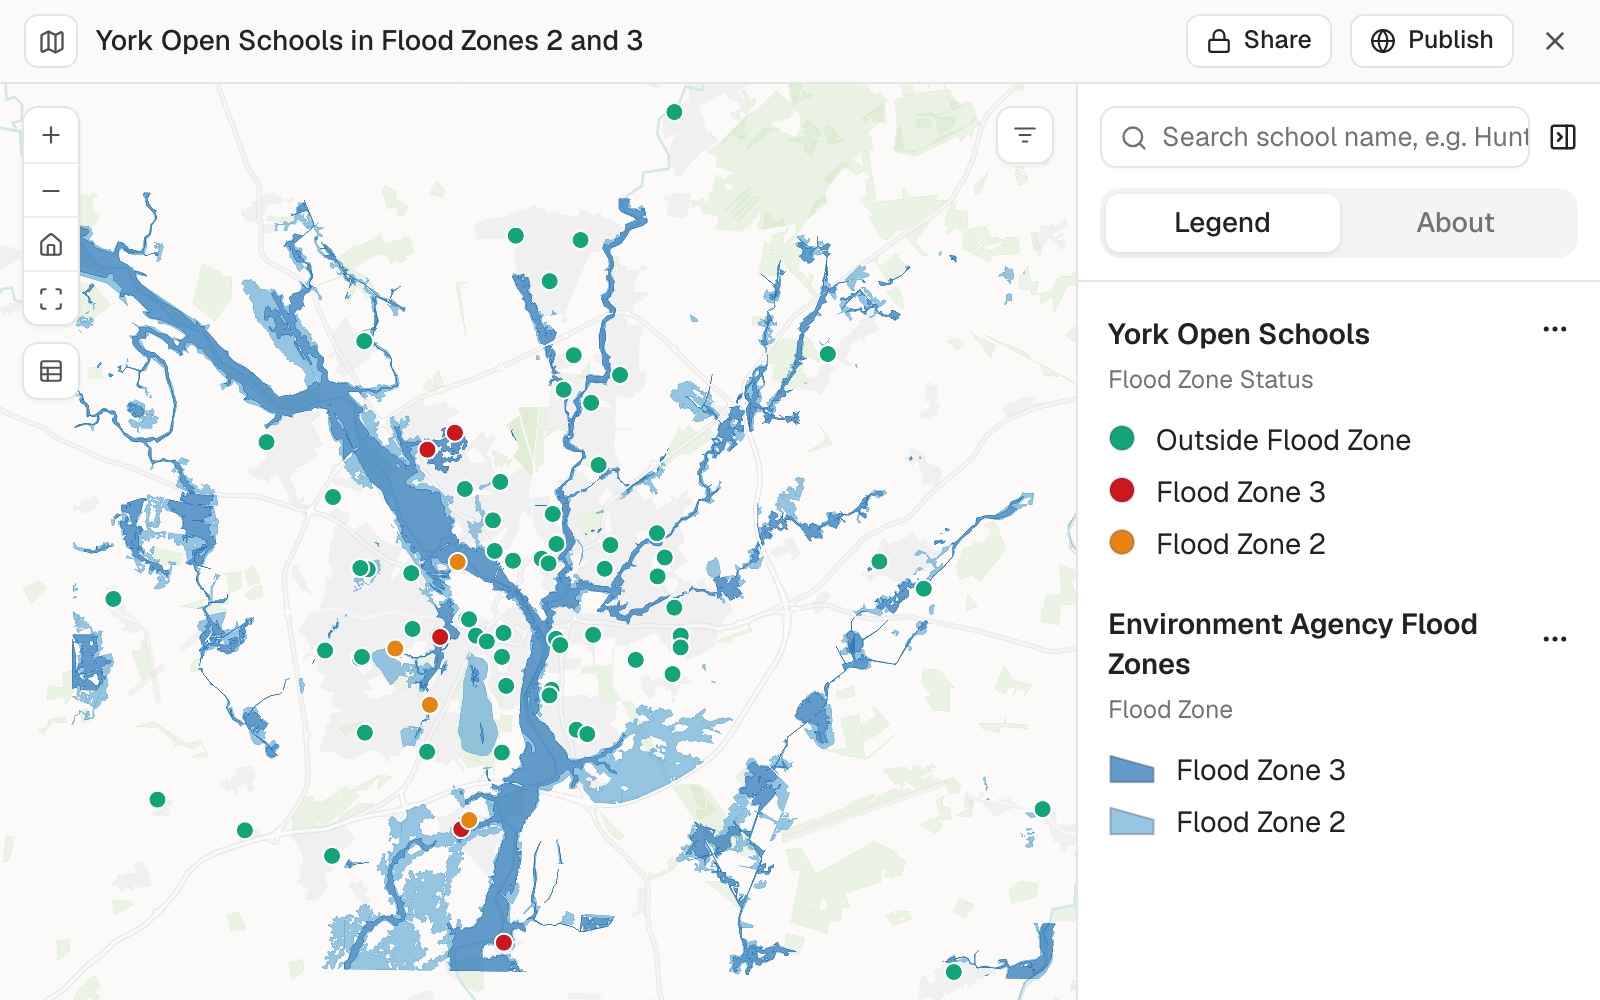 Example: York's 74 open schools coloured by flood zone, over the Environment Agency's flood zones 2 and 3: 5 in zone 3, 5 in zone 2 and 64 outside both.
You turn it into the table someone asked for
Say the columns and the rule:
Make it a table I can give to the insurer: every open school, its postcode, and its flood zone (3, 2 or none), worst zone wins where it touches both.
The table lists every site, not only the flagged ones: in the example all 74 open schools, with a summary of the counts. Copy or download it from the buttons at the top of the table.
You check the sites near a zone edge
A site a few metres from the edge of a zone can come out either side of it, depending on exactly where its point sits. Those are the ones to look at, the way you would check a colleague's work: name them, say what your own check found, and ask Mapstack to test them against the polygons using the exact coordinates in your file. In the example two schools sat close to a zone edge:
Our own check puts Saint Barnabas in flood zone 2, about 30 m outside the nearest zone 3 area, and Clifton With Rawcliffe Primary inside zone 3. Can you check both schools against the flood zone polygons again and correct the table if they're wrong?
Mapstack re-ran the overlay for all 74 open schools on the eastings and northings from the register and gave the final table, with both schools in the zones the check expected. Every row agrees with the separate check. Asked to, it updated the map to match.
You check several hazards at once
One hazard is rarely the whole question. Attach each hazard layer and the rule for scoring, and every site is rated against all of them in one ask.
A county preparedness planner in Sonoma County, California, did this for the 133 licensed health care facilities on the state's public list, against three published layers: the state fire agency's fire hazard zones, the federal flood zones and the state's earthquake fault zones.
Give every facility a rating for each hazard: wildfire from the fire zones, flood (high for zones A, AE, AH, AO, A99 and VE, moderate for the 0.2% annual chance zone) and earthquake fault (inside a fault zone or not). Where a facility touches two classes of one hazard, the worse one counts. Then score each one: 3 points for Very High fire or high flood, 2 for High fire, moderate flood or a fault zone, 1 for Moderate fire, added up. I want a table of every facility, highest score first, and a count of facilities at each score.
You get a ranked table of every site with its rating for each hazard and its score, and a count of sites at each score: 4 of the 133 scored five, and 87 scored nothing. More on scoring to a scheme of your own in Score, rate and cost by your own rules.
Buildings and facilities, both ways round. For a plan that must say what is exposed, ask for the buildings in each hazard area and for the critical facilities by name. You get one list by hazard and one by facility, each facility with the hazards it sits in.
Make it your own
Which facilities are in more than one hazard area? List them by name with each hazard.
Common questions
What if my zones file won't load?
A national layer is very large (Sizes and limits), so download only the area your sites are in. If Mapstack says some shapes cannot be read, repair them in a GIS (in QGIS, Fix Geometries), keep only the polygons, and attach the repaired file.
How do I check the result?
Start with the sites near a zone edge: one a few metres from it can come out either side, depending on where its point sits, and a site placed at its postcode can be tens of metres from the building. Ask about any one by name, "Is Saint Barnabas CE Primary in flood zone 3?", and ask for the coordinates in your file to be used.
Why are some sites missing?
Rows with no coordinates and no usable address cannot be placed. Ask how many were left off and which: in the example, 16 of the 178 schools.
Can I get a flood depth or probability for each site?
Not from a grid. Mapstack gives each site the zone class from a layer of polygons. A grid of depths or probabilities can be shown on the map, but it is not read off at each site.