

Make a map
Mapstack designs an interactive map from your data for what it is for, and changes anything on it when you ask: colours, symbols, popups, filters, basemap.
A Mapstack map is a live, interactive web map: one or more of your datasets drawn as layers over a basemap, with a legend, popups, search, filters and charts for the people who read it. GIS people would call it a web map.
People use it to see where things are and explore them, and to give other people something to explore: customers or sites coloured by a column, areas shaded by a rate (a choropleth), counts as circles sized by value, a heat map of incidents, a survey over satellite imagery, a scan of a site in 3D, sightings played week by week. The asks on this page are examples of the kind of thing to say.
A map asked for in plain words: London's wards fill in class by class from Census 2021 population density, then Church Street, the most packed, is opened to check its figure.
- Who can use it
- Free, Creator and Creator Max. A Viewer can open a map, use its tools and ask about it.
- You provide
- Data in the conversation or your Library, and what the map is for
- You get
- An interactive map, kept in your Library, to share or publish
Start a map
You say what the map is for, and Mapstack designs it: how each layer is drawn (its style), the colours and classes, what a reader sees when they select something, where the map opens and which tools readers get. Say as little or as much as you like. What you state is used as stated; what you leave open, Mapstack decides and tells you what it chose.
What to give it:
- Data: at least one dataset with points, lines or areas, or imagery or a scene, in the conversation or your Library.
- What the map is for. One sentence is enough: who reads it and what they need to see. For tools, name the readers and their task: "survey volunteers who need to find a site by its code".
- The columns to use, where it matters: the one to colour or size by, the values for a popup in order, a column readers recognise for search.
- A title, if you want particular words.
It designs more than you asked for. Mapstack adds what the map's readers would want. Asked only for a choropleth of bus stops per ward, it also added hover tips, popups, a search box for ward names and a chart of how the counts are spread. Every layer a reader can select gets a popup.
It chooses when you do not, and tells you why. With every map comes a list of the design choices it made and why, any caveats a reader should know, anything you asked for that it could not do (and what it did instead), and suggestions for what else the data could show.
It asks when the answer would change the map. If a missing fact, or two readings of your request, would change what the map means, Mapstack stops and offers up to five options. Nothing is built until you choose. It does not ask about cosmetic choices: it makes them and tells you.
It says so when a request would mislead. If what you ask for is possible but would give readers the wrong idea, Mapstack offers a sounder way alongside the option to go ahead as you asked.
It keeps to your columns. If a column you asked for is not in the data, Mapstack never fills in a stand-in. The map is built without it and the gap is listed; if it was the main thing you asked for, Mapstack stops and names what is missing.
A map shows your data as it is. When something has to be worked out first (counting points in areas, drawing walking catchments, joining tables), Mapstack works it out, keeps the result as a dataset and draws the map from it. You can ask for both in one message.
You get a card in the conversation that opens the map, with a line saying what it holds (such as "2 datasets · 1 image"). The map is in your Library.
Make a map from your data
Say what the map should show and, if it matters, how. A request that says exactly what you want is carried out without further questions. One that is open gets a short proposal first.
Map these food businesses in Liverpool and colour them by hygiene rating
Two files attached: the NaPTAN export for Merseyside and Liverpool's May 2024 ward boundaries (ONS, BGC). Keep only active bus stops (StopType BCT, Status active). Spatial join the stops to the wards, count stops per ward, and give me the table plus a choropleth of stops per ward, natural breaks, 5 classes. Tell me how many stops fell outside the 64 wards.
Say what the map is about
The About tab of the side panel carries a description for readers and the sources.
Write the About text to say what the map shows and where the data comes from
Layers, imagery and 3D scans
| Kind of data | Drawn as |
|---|---|
| Points, lines or areas | A layer each, with its own style, labels, popups, filters, charts and table |
| Imagery | A layer under your data, shown in one of its display styles. Readers can switch the style |
| A scene | Drawn in 3D. The map offers tilt |
Layers are drawn in order, the first on top, and one dataset can give more than one layer. Layers can sit in named groups with one switch, and a group can show its layers one at a time: prices in different years, for example. A layer can start hidden, have an overall transparency, or show only between two zoom levels.
Relief comes from imagery. Basemaps do not raise the ground in 3D. An elevation model you upload as imagery is what stands up in 3D view.
Two versions of the same thing can sit on one map as layers a reader switches between (a baseline and a proposal, this month and last) with a third layer classing every record by the difference, so the comparison is on the map rather than in two of them.
A highlight layer sits over the rest. Ask for the worst fifty, or the clashes, and they are drawn as their own layer above everything else, with the full set still underneath in muted colours.
Put imagery or a 3D scan under your data
Imagery (aerial photos, satellite images, elevation) and scenes (lidar and 3D models) go on a map like any other layer. Anything already in your Library can be named instead of uploaded again. See Put aerial, satellite or elevation imagery on a map and Put LiDAR, point clouds and 3D models on a map.
This is the Copernicus GLO-30 DEM tile N53 W003 (30 m, EPSG:4326). Show it as shaded relief with an elevation colour ramp, tell me the min and max elevation and the vertical units, and put the Liverpool ward boundaries from my library on top.
Colour, size and classify
Unless you say otherwise, numbers are shown in five classes by natural breaks, and the palette's light or dark version is picked to suit the basemap. A whole-number column with ten or fewer different values (a rating from 1 to 5, say) gets one class for each value. A pale class that would vanish into the basemap gets a different ramp or an outline. Every style comes with a legend that explains how to read it, and on a layer coloured by categories or classes, readers can show or hide each group from the legend.
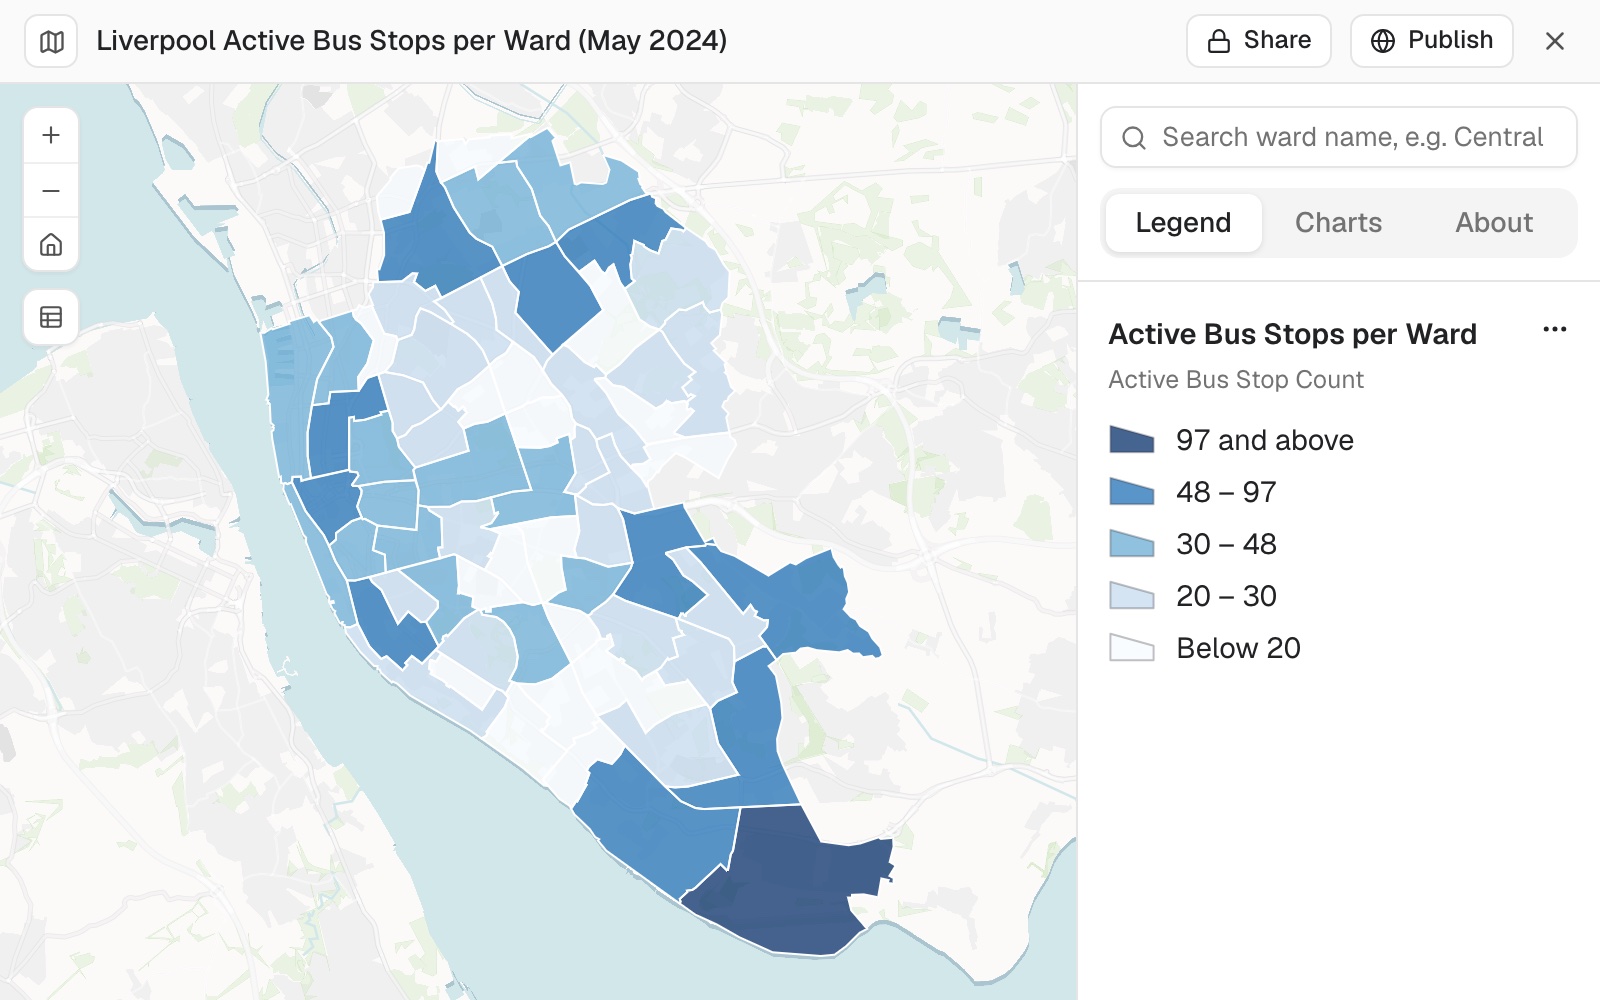 Example: active bus stops per ward in Liverpool, five classes by natural breaks, with the legend open.
Shade areas by a number: a choropleth or graduated colours
Name the column. Add the number of classes and the method if you have a view; otherwise Mapstack uses five classes by natural breaks. A rate or a share suits shading. A count is usually better shown as sized symbols, because a big area with a big count looks more important than it is.
Colour the wards by the share of residents within a 400 m walk, five classes, light to dark
Size symbols by a value, or colour them by category
Proportional symbols make bigger circles (or wider lines) for more. Colour by category gives each value of a text or code column its own colour. The two can be combined on one layer.
Size the stops by the number of services and colour them by operator
Set the classes, breaks and colours exactly
Give the breaks, the classification method, the palette, colours as hex codes, line widths or transparency. What you state is used as stated. The palettes you can name are listed under Reference on this page.
Use breaks at 80, 90 and 95 on the access layer, and switch the palette to viridis
Show where points are concentrated: a heat map or clusters
A heat map or clusters show density on screen. To count points into hexagons or grid cells, or to find statistically significant hot spots, ask for the analysis and then for the result to be shaded: see Count and summarise by area and Find patterns, hot spots and clusters.
Show the bird sightings as a heat map
Show two measures, the leading category, or dot density
Two measures in one colour grid (bivariate), the leading category in each area (predominance) and dot density each need a column or dataset that holds the combined class, the leader or the dots. Mapstack tells you when that is missing, and can add it in the same ask.
Symbols and labels
Let one column set the shape and another the colour
Circles for one kind of record and squares for another, coloured by something else entirely, with both readings in one legend.
Make the care homes circles and the home care services squares, coloured by their latest rating
Choose symbols, icons and line styles
Points can be a shape or one of the Maki and Temaki icons. Lines can be dashed or carry arrows. Areas can be filled solid, hatched or drawn as an outline only. A column can also set each record's transparency, or turn a point marker to a bearing.
Draw the ward boundaries as grey outlines with no fill
Label places
Labels come from a column, and can differ by condition: a different label for the largest places, say. Labels that would overlap are left off, so on a crowded layer ask for labels only on the largest or most important places.
Popups, filters and charts
Readers find these on the map itself:
- Popups open when a reader selects a record. Hover tips show when the pointer rests on one.
- Filters are under Filters, with Reset all. Filters in use show as chips a reader can clear.
- Charts are on the Charts tab of the side panel, for the whole map or for what is On screen. With filters and charts, a map works as a live dashboard for a team: see Build one screen that shows what is happening where.
- The table opens from Table, and can be limited to records on screen.
- Search looks in the map's own records (a reference number, a name, an address column), lists the matches with a count, and flies to the one a reader picks with its popup open.
Records stacked in one spot are all reachable. Where several sit on top of each other, a reader's tap opens one card that pages through them ("1 of 14 records at this spot") with arrows to step through.
A number filter shows the shape of the data. Its range slider carries a histogram of the values above it, so a reader sees where the bulk sits before they cut.
A heat map shows the records themselves once a reader zooms in, with their popups, so the pattern and the detail are one map rather than two.
Most of this arrives without being asked for. Mapstack adds the search, filters and charts that suit the data it has just mapped. Ask for a particular one and you get it; say nothing and you still get a map a reader can interrogate.
The views work together. Filters, charts, the table and the time slider all show the same records: filter the map and the charts and table follow. Selecting records in a chart or the table can highlight them on the map.
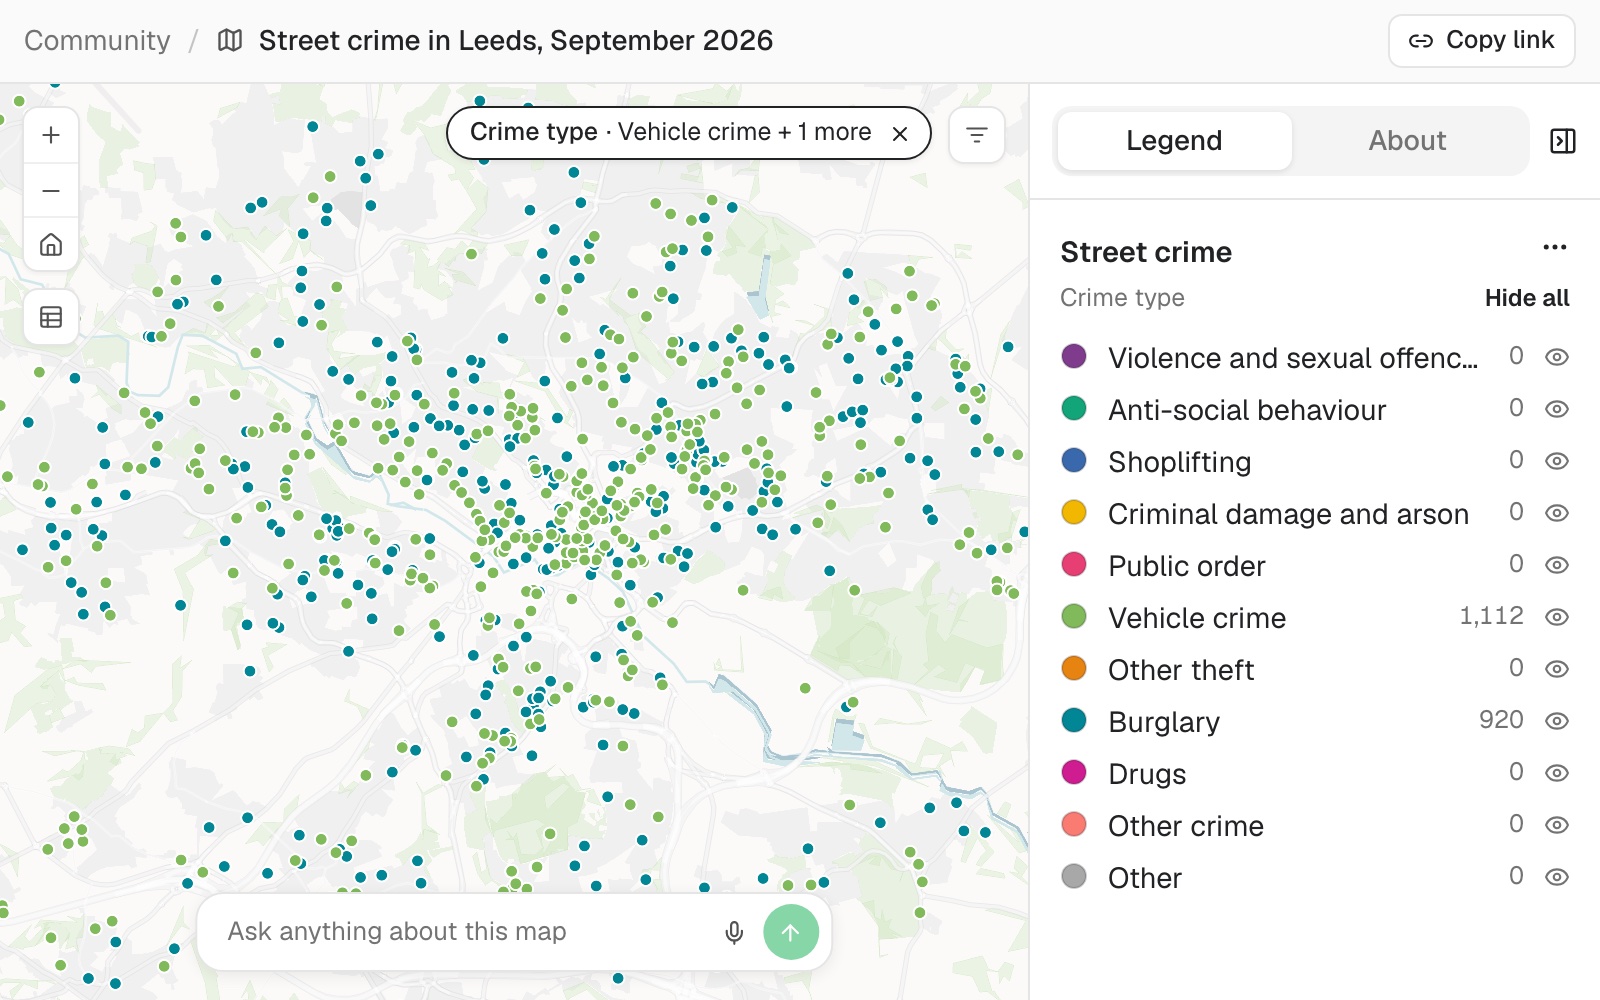 Example: Leeds street crime for September 2026 with a reader filter on crime type. The chip shows Vehicle crime and one more, the map shows only those 2,032 crimes, and the legend counts follow: 1,112 vehicle crimes, 920 burglaries and 0 of every other type.
Choose what a popup shows
Say which values matter and in what order. A popup can lead with one or two large figures, show a small chart of the record's own numbers, compare a value with the average, or show a picture or a link from a column of web addresses.
Put each hotel's price and rating in the popup as headline figures, then its address
Let readers filter the map
Name the columns. A filter can be a list of categories, a range of numbers or dates, or a preset such as "open now". A fixed filter instead keeps only matching records on a layer, for every reader.
Add filters for star rating and price range to the hotels map
Add a chart beside the map
Say what it should count or compare. Charts are worked out from the map's records and follow its filters.
Add a bar chart of museums by type, and make clicking a bar highlight those museums on the map
Work out a value for each record
A calculated value is worked out from a record's own columns: a rate, a share, an area, a length, the days between two dates, or a band such as budget, mid-range and luxury. It can then be used in popups, labels, filters, charts and styles. A calculated value a record cannot supply stays blank, never an assumed value.
Show price per guest in the hotel popups
Show change over time
A time slider plays, pauses and steps through the period.
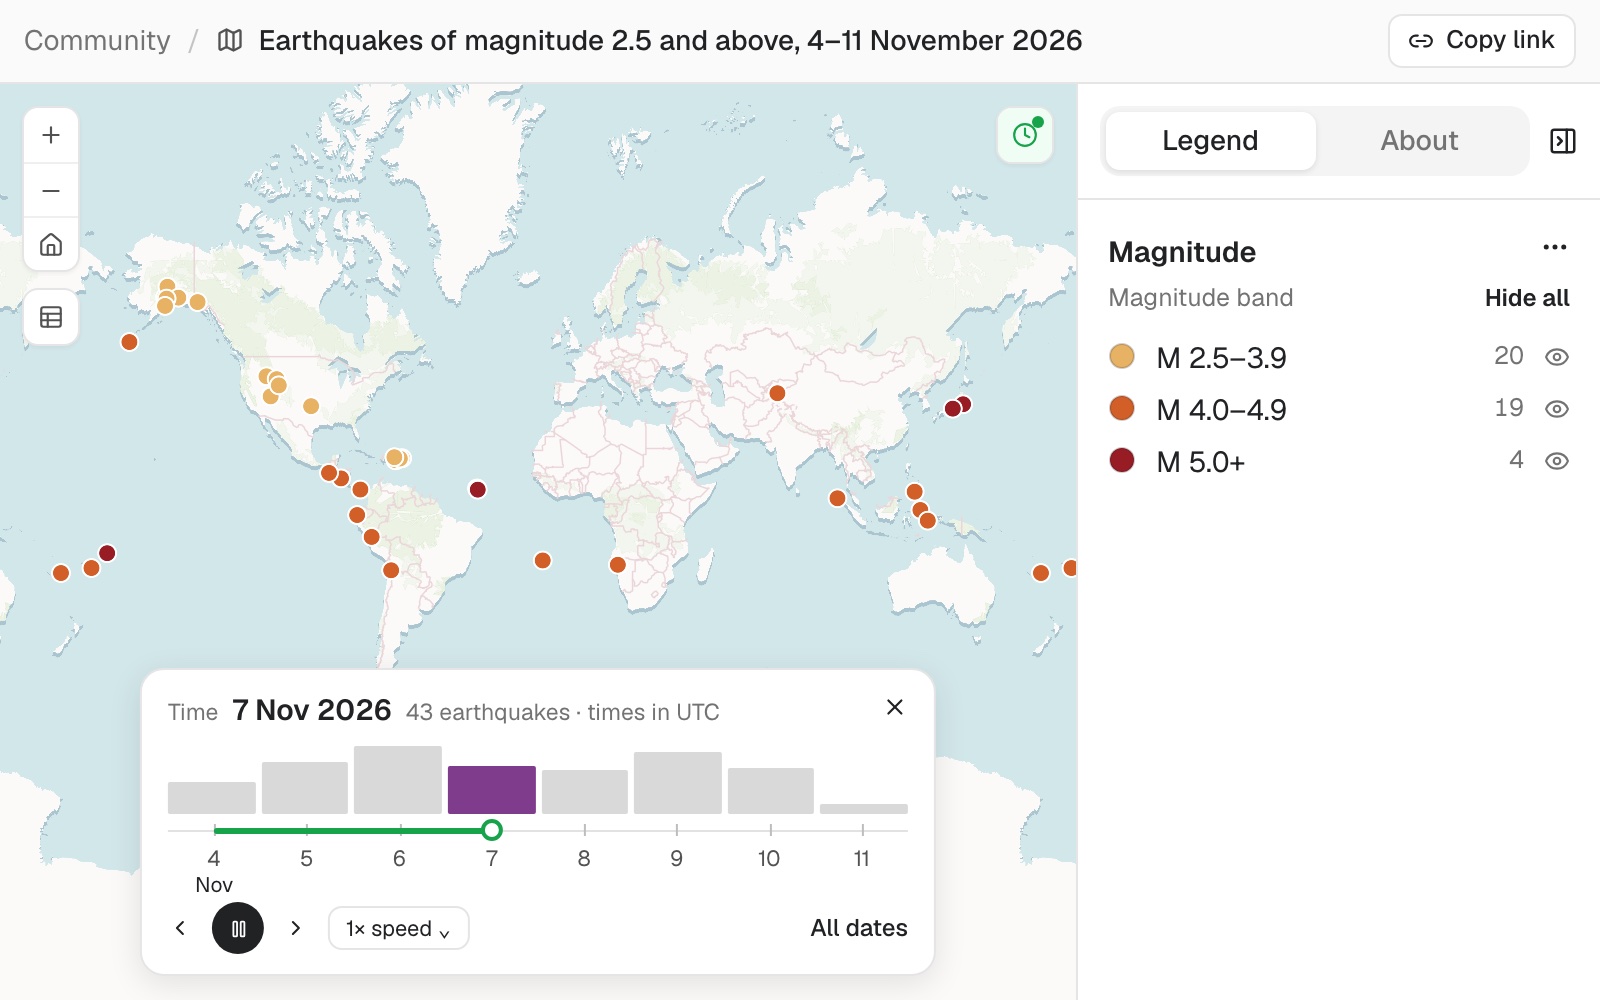 Example: a week of earthquakes of magnitude 2.5 and over, played day by day. On 7 November 2026 the map shows that day's 43, and the legend counts follow: 20, 19 and 4 by magnitude band.
A map of change is drawn around zero. Ask for the change between two years, and rises and falls get different colours on either side of no change.
Play it through time
The layer needs real dates: an event date, start and end dates, or a value for each date in its own column. If your dates are text, ask for the column to be turned into dates first.
Add a time slider so I can play the bird sightings week by week
Basemap, opening view and tools
Left to itself, a map opens simply. It frames all its data, flat and north up, on a quiet basemap made for data, light (or dark under a heat map) with place names. Opening view, Full screen and the table are on, and the legend is open. Measure, a scale bar, coordinates, 3D view, My location and a basemap switcher are added when a reader has a use for them.
Readers find Search, Bookmarks, Opening view, My location, Full screen, Measure and 3D view, and the basemap switcher at the bottom left, wherever the map has them. The legend turns layers on and off.
Change the basemap
The basemap is the background map under your data. Name one from the list under Reference on this page, or say what it is for ("show the buildings", "show the terrain").
Put the trail routes on a satellite basemap with place names
Choose where the map opens, and add bookmarks
A map can open on all its data (the default), one layer, one record, a bookmark, or a box you give as coordinates. Bookmarks are named views a reader can jump to.
Open the map on the campsites layer, and add a bookmark for each of the three festival sites
Give readers a tool: search, measure, my location, 3D
Say who needs it and why. Mapstack adds a tool for a task a reader has.
The trail-building team needs to measure distances: add a measure tool and a scale bar in kilometres
Change a map later
A change keeps the map; a new request makes a new map. Ask for a change and you get the same map updated, with a list of what changed. Ask for the same thing twice and the two maps will differ: each is a fresh piece of design.
It stays live. A map shows its datasets as they are now. Fix a record in a dataset and every map made from it shows the fix.
Readers' choices are their own. What a reader filters, switches off in the legend or changes in the basemap switcher changes their view only. The map keeps its design.
Every map has Share and Publish, on the page the map opens in. See Share with people and Make something public.
One sentence is enough. "Open on the county." "Make the flood zones soft blues under the sites." "Leave out the unclassified class." "Round the labels." Field names from the source can be put into a reader's words the same way.
A copy in another language. Ask for the map in Spanish, and the title, the layer names, the popup labels and the search prompt are translated into a second map. The data and the first map stay as they were.
Change it later
Say what should change. Anything you do not mention stays as it was, and you get a list of what changed.
On the map, make the rating 3 businesses red so they stand out
Go back to an earlier version
Every change is a version. Each time a map is made or changed, the design is saved as a new version, and Version at the top of the map shows which one you are looking at. Going back brings an earlier design back as the newest version, so the one you left stays in the list and you can return to it.
- Open the map.
- Select Version at the top. Each version shows its number, what changed and when; the live one is marked Current.
- Select the version you want, then Restore to confirm.
The map changes in place. A change card in the conversation also shows Revert when its version is no longer the current one: it restores that version the same way.
The design goes back; the data does not. A version holds the map's look, layers, popups and opening view. The map still shows its datasets as they are now, so a fix you made to a dataset stays.
You can also ask: Mapstack says which version the map is on and brings back the one you name.
The newest versions are kept, and any replaced in the last day; how many is in Sizes and limits. Only someone who can edit the map sees Version.
Go back by asking
Name the version, or say how far back. The version you leave stays in the list.
Which version is the population map on now? Restore it to version 3.
Reference
Styles, and what each needs
| Style | Shows | Needs | On |
|---|---|---|---|
| One symbol | Every record alike | Nothing | Points, lines, areas |
| By category | A colour for each value | A text or code column | Points, lines, areas |
| By number (choropleth, graduated colour) | A number in classes, light to dark | A numeric column; a second can divide it to make a rate | Points, lines, areas |
| By date | A ramp from oldest to newest, or before and after a date | A date column | Points, lines, areas |
| By size (proportional symbols; line width on lines) | Bigger for more | A numeric column | Points, lines, areas |
| Colour and size together | Two measures, or a category and a measure | Two columns | Points, lines, areas |
| Heat map | Relative density on screen | Points; a column can weight them | Points |
| Clusters | Counts that split as you zoom in | Points or areas | Points, areas |
| Pie or donut at each place | Parts of a total | 2 to 8 numeric columns that add up to a total | Points, areas |
| Above and below a reference | Two colours, sized by distance from the mean, median or a number you give | A numeric column | Points, areas |
| 3D extrusion | Areas raised to a height | A numeric column, or one fixed height | Areas |
| Bivariate | A 2×2, 3×3 or 4×4 colour grid | A prepared column of combined classes | Points, areas |
| Predominance | The leading category | A prepared column naming the leader | Points, areas |
| Dot density | One dot for so many | A prepared dataset of dots | Points |
Classes: natural breaks (the default), quantile, equal interval, standard deviation, your own breaks, or a continuous ramp. 2 to 10 classes; 5 by default. A layer coloured by category names the ten most common values by default and groups the rest as "Other"; ask for more, up to 50, or name the values to show.
Palettes, by name
| Kind | Palettes |
|---|---|
| Sequential | blues, greens, oranges, purples, reds, greys, yellow-orange-red, yellow-green-blue, viridis, magma |
| Diverging | red-blue, red-yellow-green, purple-green, brown-teal, pink-green |
| Categorical | bold, pastel, muted, dark, paired |
| Density | inferno, hot, cool-glow |
| Bivariate | blue-red, teal-purple, green-orange |
Red-yellow-green, bold and pastel are not safe for colour-blind readers; dark, paired and hot are partly safe. Any palette can be reversed or centred on a value, and any colour given as a hex code.
Symbols: point shapes (circle, square, diamond, triangle, cross, x) and 705 icons from the Maki and Temaki sets. Lines: width, twelve dash styles, arrows. Areas: solid or hatched fills, or outline only.
What readers can find out and do
| Part | What it holds | Options |
|---|---|---|
| Labels | Text from columns, with conditions (a different label for the largest places) | Regular, bold or italic; 6 to 48 pt; halo or box; shown between chosen zoom levels |
| Hover tips | A title and the columns you choose | Not on touch screens |
| Popups | Lists of values, sentences, headline figures, a small chart, a comparison with the average or median, position in the range, a progress bar, tags, a picture, a link, sections and tabs | One record at a time |
| Fixed filter | Keeps only matching records on a layer, in its table and charts too | Text, number and date conditions; relative dates such as "in the last 7 days" update while the map is open |
| Reader filters | Categories, number or date ranges, or presets | Can start switched on, and can zoom to what matches. One filter can cover several layers |
| Table | One for each layer | Readers can search, sort and limit it to what is on screen |
| Charts | Bar, line, pie or donut, histogram, scatterplot (with a fitted line and R²), box plot, calendar heat chart | For the whole map or what is on screen |
| Time slider | Steps by minutes to years, or a number of steps | Window, cumulative or instant; 0.1 to 60 seconds a step; can loop |
| Calculated values | Arithmetic, conditions, text functions, area, length, days between dates, and a column's total or mean across the dataset | Read from one dataset |
Numbers can be shown as plain, currency, percent or compact (1.2M), with 0 to 8 decimals; dates in nine formats from "5 March 2026" to "2026-03-05".
Basemaps
| Basemap | Good for |
|---|---|
| Dataviz | A quiet background for data |
| Backdrop | Subdued context with shaded relief |
| Base | Plain orientation with little detail |
| Streets | Roads, addresses, transit, local buildings |
| Bright | Detailed roads, land use and points of interest |
| OpenStreetMap | A familiar detailed reference map |
| Satellite | Imagery, to see buildings and land cover |
| Hybrid | Imagery with roads and place names |
| Topo | Contours, shaded relief and access routes |
| Outdoor | Trails, cycling routes and elevation |
| Winter | Ski routes and mountain terrain |
| Landscape | Physical geography under routes or data |
| Ocean | Sea depth and seafloor relief (not for navigation) |
| Aquarelle | A watercolour background for illustrative maps |
Each also comes in a dark version, and place names can be on or off. Basemaps are from MapTiler; satellite imagery dates and detail vary by place.
Tools
| Tool | What it does | On unless you say |
|---|---|---|
| Opening view | Back to where the map opened | Yes |
| Full screen | The map fills the screen | Yes |
| Table | The records, searchable and sortable | Yes |
| Search | Finds records by a column, exactly or by part of the text | No |
| Bookmarks | Named views | Once there are any |
| My location | Shows where the reader is | No |
| Measure | Distance and area, metric or imperial | No |
| 3D view | Tilt and turn the map | No |
| Scale bar | Metric, imperial or both | No |
| Coordinates | A readout in decimal degrees, degrees and minutes, UTM, MGRS or USNG | No |
| Basemap switcher | Readers change the basemap | No |
Opening view: flat or a globe, a rotation, and a tilt up to 60 degrees for 3D.
What it can't do
- Be downloaded as a picture. For a map on paper, in a slide or in a document, ask for a print, designed for where it will be seen.
- Carry written analysis. A map stays a view of its data; the written account belongs in a report.
- Be changed by hand. There is no style editor: every change is asked for.
- Give one layer two styles at once. For two views of the same records, ask for two layers in a group that shows one at a time.
- Style imagery or scenes, or give them popups, filters, charts or a table. Readers switch their display.
- Show a map holding a scene as a globe. It is drawn flat.
- Restyle a basemap's own roads or labels, or raise the ground from a basemap. Elevation imagery stands up in 3D.
- Search for addresses. Search finds records in the map's own data.
- Show hover tips on a touch screen, or labels, hover tips or popups on a heat map.
- Export a chart, or take typed-in chart values. Charts are always worked out from the data.
- Link views of two different datasets, or read another dataset in a calculation.
- Be made or changed from a Viewer seat.
Common questions
Can I choose the colours?
Yes. Name a palette from the list on this page, such as viridis, or give hex codes for particular values. What you state is used as stated; what you leave open, Mapstack chooses and tells you which.
Why do the biggest areas look the most important?
When areas are shaded by a count, a big area with a big count draws the eye. Ask for a rate instead (per head, per square kilometre), or for the count as sized symbols.
Can I put a pie chart at each place?
Yes, from 2 to 8 numeric columns that add up to a total. Beyond about 100 places the pies crowd the map; ask for clusters drawn as donuts, which group as you zoom out.
Does the map change when my data changes?
Yes. A map reads its datasets as they are now, so a record fixed in a dataset is fixed on every map made from it. Reports and prints keep the copy they were made from. See Edit your data and undo changes.
Can people without an account see it?
Once you publish it. A map starts private to your workspace. See Make something public.