

Choose where to go next
Find places like your best ones, score places on several measures, and choose the sites that serve your customers best by travel time.
Where to open next, where to test next, where to put the money: Mapstack answers these three ways, and they work well in turn.
- Find places like your best ones. Describe the places where things already work by a few measures, and rank every other place by how closely it matches. GIS people call this similarity search.
- Score places on several measures. Put income, age, rent or footfall on a common scale, weight them and combine them into one score, so places rank simply. This is a composite index.
- Choose the best sites. From your candidate sites, choose the few that serve demand best by travel time: the least total travel, the most people within 15 minutes, or full coverage with as few sites as possible. GIS people call this location-allocation.
The first two find the areas worth a look. The third chooses among real sites. Each result comes as a table in the conversation with its figures. Ask to keep it and you get a new dataset, ready for a map: where the look-alikes are, the areas coloured by score, or the chosen sites beside the demand they serve.
The asks on this page are examples of the kind of thing to say. Change the names to your own data.
- Who can use it
- Free, Creator and Creator Max. A Viewer can ask for similarity rankings and scores as answers; choosing sites is not on a Viewer seat.
- You provide
- Your places with the measures to compare, or demand and candidate sites
- You get
- Places ranked or scored, or the chosen sites and the demand each serves
Places like your best ones
Where to expand next: towns that look like the ones where you do best. Where to test or campaign: areas like the ones where a pilot worked, or postcodes like the ones your best donors come from.
Bring the reference places, named so Mapstack can pick them out, and the places to rank, with the same numeric measures for every place. Commercial lifestyle classifications are licensed from data vendors. If you have one, bring it as a column. Otherwise build the profile from census figures. You get the places ranked from most alike to least alike.
The measures decide what "alike" means. Two towns can match on income and age and be nothing alike for your purpose. Choose the few measures that explain why the reference places work, and leave out the rest. Mapstack finds the reference places by name, and if a name could mean more than one row, it asks which you mean.
A match is a ranking, not a forecast. A close match says a place looks like your best ones on those measures. It does not say the shop will do as well there.
Find places like your best ones
Name one or more reference places and the measures to compare on. Ask for the top of the list if that is all you need.
Which neighbourhoods are most like Camden on median income, median age and population density?
Which wards are most like the three wards where our pilot worked best? Compare them on household size and car ownership.
Give me the ten sites most like our best-performing store
Bring in census measures to compare on
The measures have to be columns in your data. If they are census figures you do not have, ask for them in the same message and Mapstack fetches them first.
Add census figures for age and household make-up to each area, then rank the areas by how alike they are to our three best
Fetch Census 2021 figures for age, health and housing for each ward, then combine them into one score
One score from several measures
Targeting a programme: a vulnerability score for each neighbourhood, so outreach goes to the areas above a threshold, with the method written down so it can be defended.
Bring one dataset with a numeric column for each measure, and say which measures count against, and any weights or range, such as 0 to 100. You get each place with its score, a rank and a class.
The weights are your call. There is no right answer to how much income should count against housing. Mapstack uses the weights you give, and counts every measure equally if you give none. Say your weights in the request, so the score can be explained and repeated.
One measure per idea. Two measures of the same thing, such as the number of shops nearby and the distance to the nearest shop, make that idea count twice. Choose one.
It states the scaling method. Measures on different scales have to be put on a common one before they are combined. If you have a method in mind, name it. If not, Mapstack chooses one and says which.
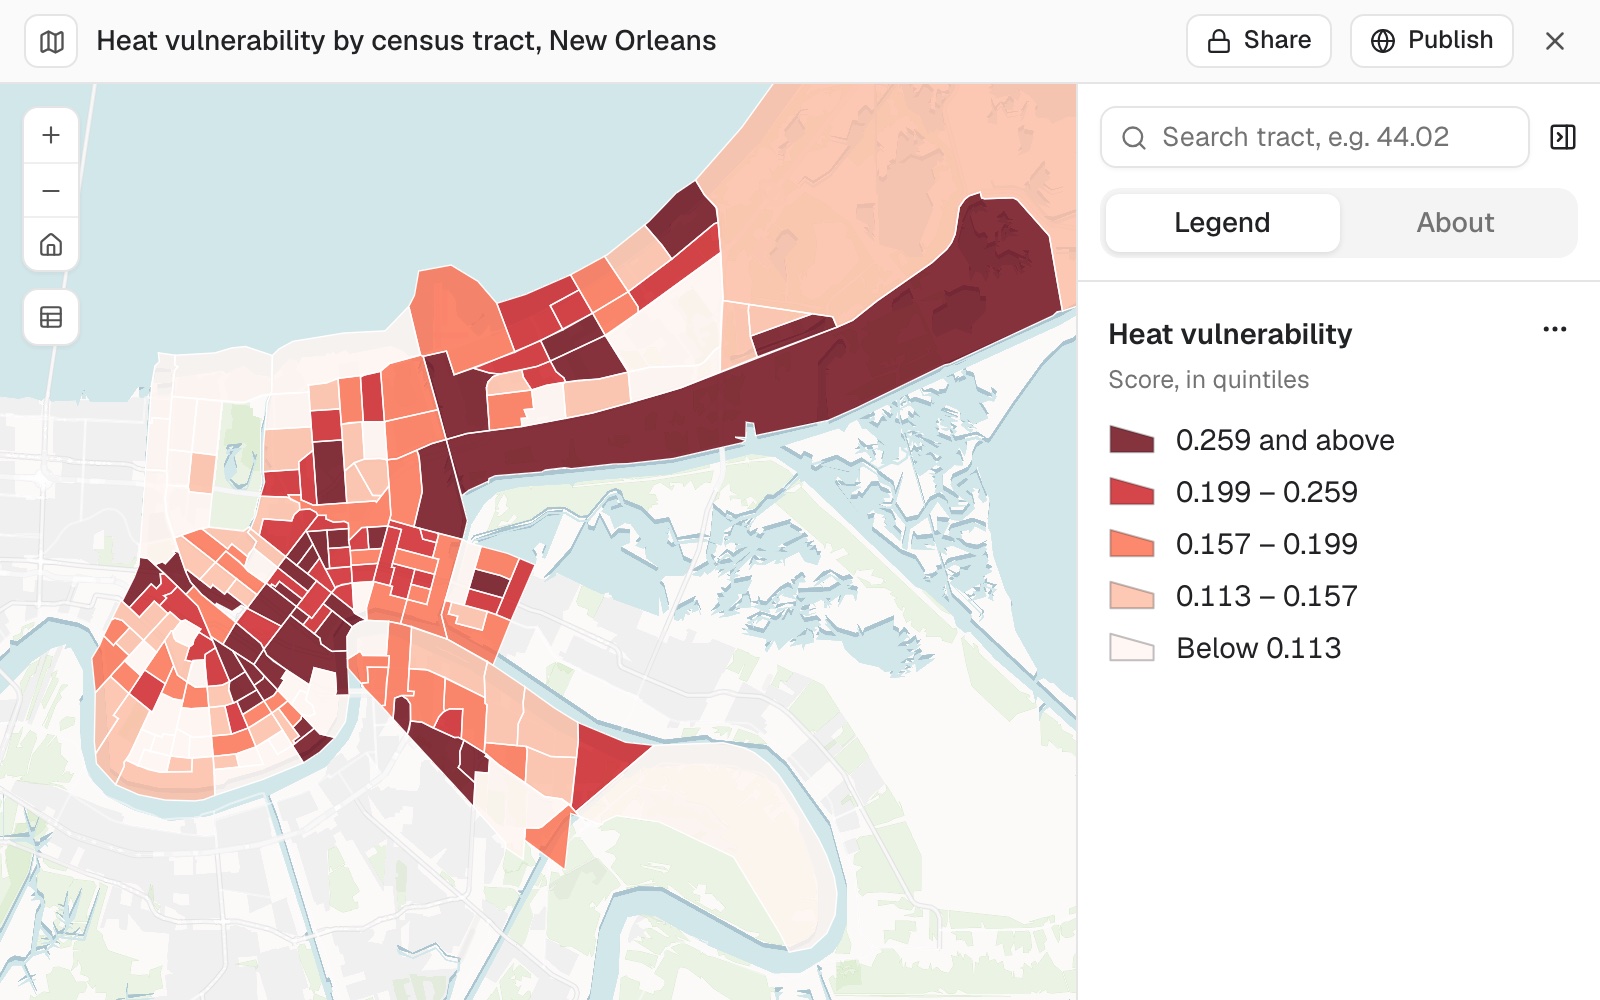 Example: heat vulnerability by census tract in New Orleans, one score from poverty, households with no vehicle, age 65 and over, and disability, in quintiles. The darkest red, 0.259 and above, is the 36 highest-scoring tracts.
Worked through, with the weights and a test of how much they matter, in the guide A score per area.
Build one score from several measures
Build a vulnerability score for each neighbourhood from income, age and housing, on a scale of 0 to 100
Make some measures count against the score
For a measure where more is worse, say so: a higher value then lowers the score.
Score each candidate site on footfall, rent and number of competitors. Lower rent and fewer competitors should score higher.
Weight the measures, or turn the score round
A weight of 2 counts double.
Make footfall count double
Flip it so a high score means better off, not worse off
Choose the best sites
Where to expand next, as the two candidate sites that give your customers the least drive time. Decisions that are costly to reverse: where distribution centres go, which clinics to keep, where to base vans or ambulances.
Bring demand locations (points or areas, such as customers, households or census areas; areas are measured from their centres), with a column for how much demand each has if they differ, and candidate sites as points. For a coverage goal, say the travel time that counts as covered; for the capacity goal, what each site can take. You get every site marked Chosen, Candidate (not chosen) or Required (an existing site that stays), with the demand each one serves.
It chooses from your candidates. Site choice works from the sites you give it. To find candidate areas first, rank places by likeness or by score, as above.
Different goals give different answers. The sites that keep total travel lowest are rarely the ones that reach the most people within 15 minutes. Mapstack says which goal it used. If your question could mean either, it asks. The chosen sites have to work together, so two good sites side by side are rarely both chosen.
Coverage goals leave some people out. With a cutoff of 15 minutes, demand further away than that is not served by any site. The least-travel goal serves everyone.
It measures by travel time, both ways round. Travel follows OpenStreetMap roads and paths, with no live traffic. It can measure from the sites to people, as for deliveries or home visits, or from people to the sites, as for shoppers or patients. One-way streets make the two differ. Say which fits.
It asks before a large job. Routing between every demand location and the sites near it is a large job. You get a card first, saying what share of your allowance it will use, with Go ahead and Don't run it.
No shortlist yet? Ask for candidate sites to be proposed under a rule, such as at least 500 metres from an existing one. You get them as points, with the reason for each, and can choose among them.
Choose sites that keep travel as short as possible
Every demand location is served by its nearest chosen site, and the total travel time is kept as low as it can be. This is the goal Mapstack uses unless you say otherwise.
We want to open 2 new stores. Which of these 10 candidate sites would give our customers the least total drive time?
Reach as many people as possible within a time
Which 3 of the candidate sites reach the most residents within a 15-minute drive?
Reach the most, with a limit on what each site can take
Each depot can handle 500 orders a day. Choose 4 sites that cover the most orders within 30 minutes.
Use the fewest sites for a target
Which clinics should we keep so that 90% of residents are within a 15-minute drive of one?
Sites you already have
Bring any existing sites that stay open, as points. They are marked Required in the result.
Add to sites you already have
Keep our two current depots open and choose one more from the candidates
Share demand out among the sites you have
No choosing: each demand location goes to its nearest existing site.
Allocate each customer to one of our existing depots by drive time, and tell me how many customers each depot serves
Reference
| Finding places like your best | |
|---|---|
| Measures | One or more numeric columns |
| Reference places | One or more |
| Results | Every candidate, or the number you ask for |
| Building a score | |
|---|---|
| Weights | Any positive number per measure. 1 unless you say otherwise; 2 counts double |
| Measures that count against | Any of them: a higher value lowers the score |
| Range of the score | Rescaled to a range you give, such as 0 to 100 |
| Flipping the score | So a high score means the opposite |
| Goal when choosing sites | What it finds |
|---|---|
| Least travel | The sites that give the least total travel time. Used unless you say otherwise |
| Most coverage | The sites that put the most demand within a travel time |
| Most coverage, with capacity | The same, with a limit on the demand each site can serve |
| Coverage target | The fewest sites that cover a share of demand within a travel time |
| Allocate | No choice: each demand location goes to its nearest existing site |
| Choosing sites | |
|---|---|
| Number of sites to choose | One unless you say otherwise |
| Demand | From a column you name; each location counts once without one |
| Coverage target | 1% to 100% |
| Travel | Drive unless you say otherwise; also truck, cycle or walk |
| Direction | From the sites to people unless you say otherwise; or from people to the sites |
Very large results: see Sizes and limits.
What it can't do
- Choose sites that are not among your candidates or existing sites. It does not search the map for new locations.
- Compare or score on text or category columns. Each measure is a number.
- Know the right weights. Weighting is a judgement for the people who will use the score. Mapstack applies the weights you give.
- Forecast how a place will perform. A likeness ranking or a score describes places; it does not predict sales.
- Use live traffic.
Common questions
Which measures should I compare on?
The few that explain why your best places work, and no more. The measures decide what 'alike' means, so leave out the rest. If the top matches are tiny areas, ask Mapstack to leave them out: 'Leave out areas with fewer than 1,000 residents'.
What weights should I use?
That is your call: there is no right answer to how much income should count against housing. Without weights, Mapstack counts every measure equally. Put your weights in the request, such as 'make footfall count double', so the score can be explained and repeated.
Why these sites and not the best ones on their own?
The chosen sites have to work together, so two good sites side by side are rarely both chosen. The goal and the direction of travel matter too: 'least total travel' and 'most people within 15 minutes' give different answers from the same data.
Does a close match mean a new shop will do as well there?
No. It means the place looks like your best ones on the measures you chose. It is a ranking, not a forecast.
How do I check the result?
As you would a colleague's recommendation. For a score, ask 'Which measures put these five at the top?' and look at the bottom of the list as well as the top. For a choice of sites, ask which goal and direction were used and how much demand each chosen site serves, then look at the busiest and the quietest.