

See when things happen, and compare periods
The hours, days and months behind a pattern, repeat readings averaged by period, and one period set against another.
Where is half of a dated record. The other half is when. Which hour is worst? Does the pattern hold at night? How does this month compare with last? What have the readings at one point done over three years?
Bring records with a date, or a date and a time, and ask. Mapstack works the figures out for you, so you are not left dragging a slider and guessing. You get the counts in the conversation, and a map or a report that shows them.
One real file runs through two sections of this page: "When it happens" and "Patterns that change with the hour". The asks in the others are examples of the kind of thing to say.
- Who can use it
- Free, Creator and Creator Max
- You provide
- Records with a date, or a date and a time
- You get
- The figures by period, and a map or report that shows them
When it happens
The example here: every road collision the police recorded in Leeds in 2024, from the Department for Transport's road safety data. There are 1,463, each with its date, its time and its place.
Ask what the timing looks like, and you get the counts. The worst hour is five in the afternoon, with 135 collisions. The worst day is Friday, with 236. The worst month is September, with 141.
Use your own bands, not only the clock's. Name the periods your work runs on, and every record is counted into them. Here the evening peak, from three to seven, holds 469 collisions, 32.1% of the year. The morning peak, from seven to ten, holds 215.
The map and the charts follow. Each record can be coloured by its time of day. The chart can count every record or only what is on screen. Set to what is on screen, it reads the pattern again when a reader moves the map to one part of the city.
It notices what goes with the timing. Asked about the night collisions, Mapstack reported that over three quarters of them happened in darkness. It read that from a column in the file. It did not assume it.
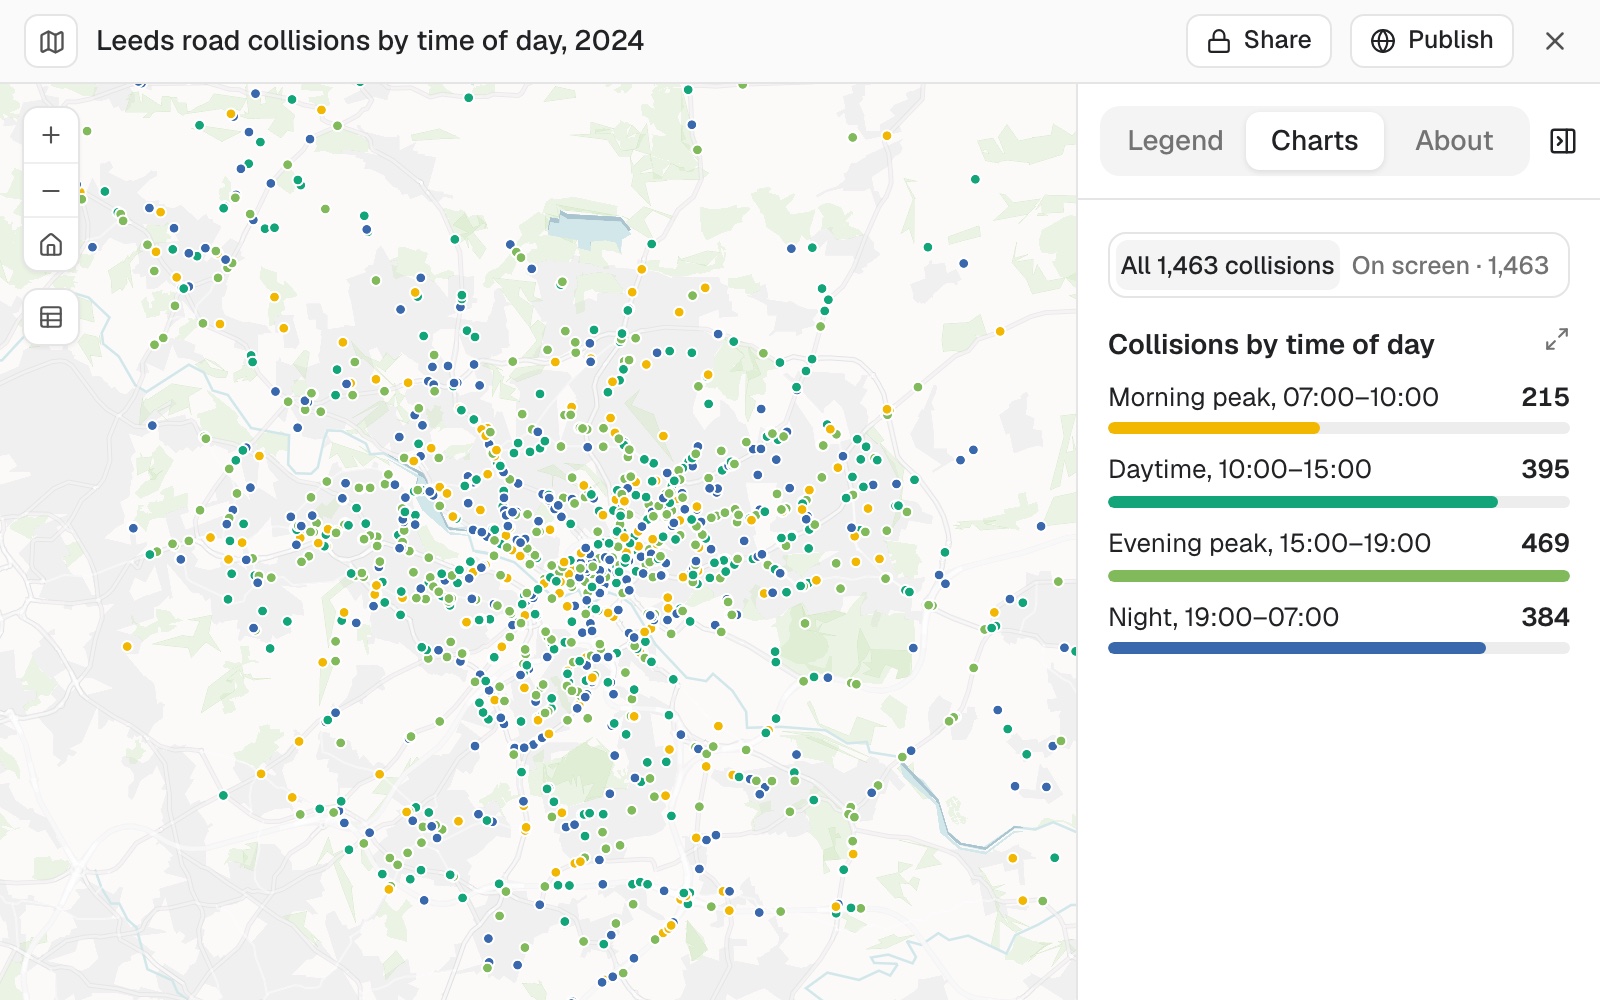 Example: Leeds' 1,463 road collisions in 2024, coloured by time of day, with the chart open. The evening peak holds 469 and the morning peak 215.
See the timing of a set of records
Which hours, days of the week and months have the most collisions?
Split them into a morning peak from 7 to 10, an evening peak from 3 to 7, and the rest, and give me the share in each
Colour the map by time of day
Colour the collisions by time of day and add a chart of the bands
Repeat readings at the same places
A table with thousands of readings from a few dozen places is a different kind of question. You want one figure for each place in each period, not a list.
Mapstack averages the readings into the periods you name. A year of hourly parking counts becomes one figure for each block for the morning, the middle of the day and the evening. Then it totals those to any larger area you give it.
A policy you state, applied place by place. Give the target, and Mapstack says for each place and period whether the figure is above it, below it or within it. It also names the exceptions: an area that is under target overall can still hold one block far above it.
Ranked both ways. The fullest and the emptiest, by name.
Average repeat readings by period
Average these hourly readings for each block for 8 to 11am, 11am to 5pm and 5 to 8pm, and total them by area
Our target is 70 to 85% full. For each area and period, say whether the rate should go up, down or stay
One period against another
Give Mapstack two periods, and it compares them category by category and area by area, in number and in percent. It names the largest rise and the largest fall.
It allows for periods of different length. October has a day more than September. Comparing the two, Mapstack adds the figures per day, because the plain change would mislead.
A change map reads as change. The result is drawn on a scale centred on no change, so a rise and a fall are different colours. It sits beside the plain map of the totals.
It says what the figures do not cover. An incomplete last month, or a column that does not mean what a reader might take it to mean.
Compare this period with the last
Compare October with September by district and by type, in number and in percent
Map the change on a scale centred on zero, beside the map of the totals
Have the comparison every month
Ask, and Mapstack gives you the steps and the wording to use in a routine, naming the same source. A routine is set up in your settings: see Set up a routine.
I want this brief every month. How do I set that up?
Two rounds of readings at the same points
Sampling is a comparison of its own. The same points are measured twice, and the question is which went up and which went down.
Mapstack matches the points across the rounds, and reports each point's two values and the direction. It counts how many were over a limit you give in each round, and names the highest and where it was. In a report, each point gets a chart over time with your target drawn across it.
It keeps kinds of measurement apart. A target for a river does not apply to the outflow from a treatment works, and Mapstack says so and does not put both on one line.
Compare two rounds at the same points
Compare the autumn and spring rounds point by point, and tell me which rose and which fell
How many samples at each point were over 0.05 mg/l in each round?
Patterns that change with the hour
A hot spot at eight in the morning is not the same place at midnight. Ask for the pattern in each time window, and Mapstack runs the search once for each. Then it lays them over each other to find the places that matter in only one.
In the Leeds example, the rush hours gave 164 significant cells and the night 104. Of the night cells, 26 appear only at night. Each window is its own layer on the map, and a reader switches between them.
More on the search itself in Find patterns, hot spots and clusters.
Find hot spots for each time window
Find hot spots for the rush hours and for the night separately, and list the places that are hot only at night
Watching it play
Where the record is a sequence, the map can play it. The time slider steps through in intervals you choose. It shows the records in each step, or everything up to it. Name the time zone, and the slider and the summary both use it.
For positions that make a path, such as vehicles, vessels or animals, see Work with lines, routes and tracks. For the slider itself, see Make a map.
Reference
| What it needs | A date column, or a date and a time. The bands are yours to name |
| Breakdowns | Hour of day, day of week, month and any bands you name, each with its share |
| Repeat readings | Averaged for each place and period, and totalled to a larger area |
| Comparisons | By category and by area, in number and percent, with figures per day when the periods differ in length |
| Change maps | A scale centred on no change |
| Time zones | Shown in the zone you name. The file is left as it is |
| Repeating it | The steps to use in a routine. A routine is set up in settings |
What it can't do
- Read dates from a column it cannot recognise as dates. It says which column it used and how it read it.
Common questions
My dates and times are in two columns. Does that matter?
No. Say which is which if the names do not make it plain, and Mapstack reads them together.
Can I choose the time bands?
Yes. Name the periods your work runs on, and every figure comes back in those, with the share in each.
The two months I am comparing are different lengths.
Mapstack adds the figures per day beside the totals, and says that it did.
Can it produce this every month?
Ask, and you get the steps and the wording for a routine. See Set up a routine.