

Count and summarise by area
Count points, total lengths and coverage, or add census figures for each of your areas, rings around your places, or cells of a grid.
Crimes per ward, customers per county, road per district, people per sales territory: summing things up by area is the commonest question in location data. Give Mapstack the areas and what to count, and you get back the areas, each with its count, its totals and anything else you asked for.
GIS people have names for each part. Finding the area each point falls inside is a point-in-polygon test, and counting the result is aggregating points. Measuring lines and areas inside other areas is summarise within. Sharing published figures such as population onto your own shapes is enrichment. A grid of equal cells to count into is a tessellation.
The asks on this page are examples of the kind of thing to say. The ones about Liverpool's bus stops were sent with real public data: the Department for Transport's NaPTAN export of every bus stop and other transport access point in Merseyside (a CSV with coordinates, 8,018 rows), and the Office for National Statistics' May 2024 boundaries of Liverpool's 64 wards (GeoJSON).
- Who can use it
- Free, Creator and Creator Max. A Viewer can ask for counts and totals as answers; census figures and grids are not on a Viewer seat.
- You provide
- What to count, and your areas, places with a distance, or a grid cell size
- You get
- Your areas with counts, totals and figures as new columns
Count points in your areas
Incidents per neighbourhood for a station review, sales per territory for a quarterly meeting, members per constituency.
Bring the points: a spreadsheet with coordinates, a spreadsheet of addresses for Mapstack to place, or a GIS file. Bring the areas, such as wards or sales territories; for official boundaries you do not have, Mapstack can fetch them (see Data Mapstack can find for you). Name any columns to total, average or break down by, if you want more than a count.
You get your areas with one new column for each count, total or average you asked for. The table for every area comes in the conversation. Ask to keep it and you get a new dataset, ready for a map. If you asked for a map, it is made from the result.
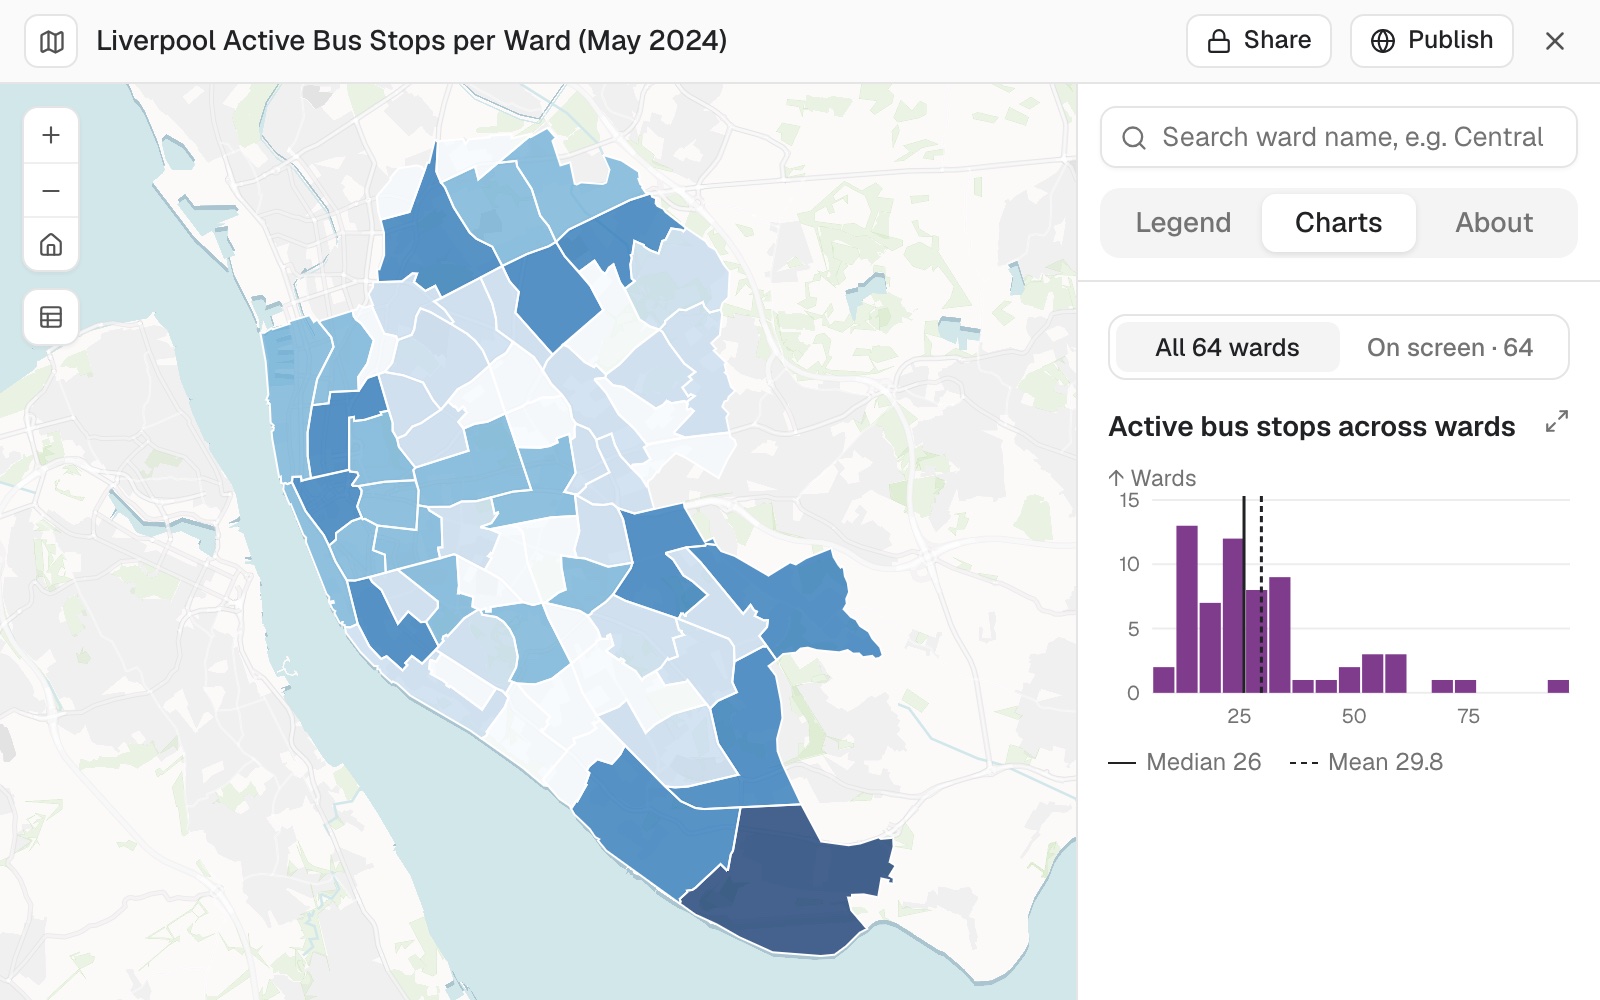 Example: active bus stops per ward in Liverpool, with the map's chart of how the 64 wards' counts are spread: a median of 26 stops and a mean of 29.8.
Without being asked, the map in the example also had pop-ups, a search box for ward names and a chart of the distribution.
It tells you what fell outside. In the bus stop example, 7,079 stops were active, 1,906 of them inside Liverpool's 64 wards and 5,173 elsewhere in Merseyside. That is expected here: the stops file covers the whole county and the wards only the city. The "outside" figure is worth a look every time, because it tells you whether the points and the areas cover the same ground.
It follows your filter, and says what it kept. Check the number against what you expected before you read anything into the counts.
Areas with nothing in them stay in. They get a count of 0, so a map of the result has no holes.
A point on a shared boundary counts in each area it touches. With points it is rare, but it means the counts across all areas can add up to slightly more than the number of points.
Count the points in each area
Attach both files and say what to count, in what, and anything to filter first. Ask for a map in the same message if you want one. Name columns to total or average too, if you want more than a count.
Two files attached: the NaPTAN export for Merseyside and Liverpool's May 2024 ward boundaries (ONS, BGC). Keep only active bus stops (StopType BCT, Status active). Spatial join the stops to the wards, count stops per ward, and give me the table plus a choropleth of stops per ward, natural breaks, 5 classes. Tell me how many stops fell outside the 64 wards.
Break the count down by kind
Name a category column. You get the count of each kind in each area, and can ask for the least and most common kind in each.
For each ward, break the stop count down by stop type
For each ward, how much land is in each land-use type?
Rates per head
A rate per 1,000 residents makes a fair comparison, so big areas do not win by size.
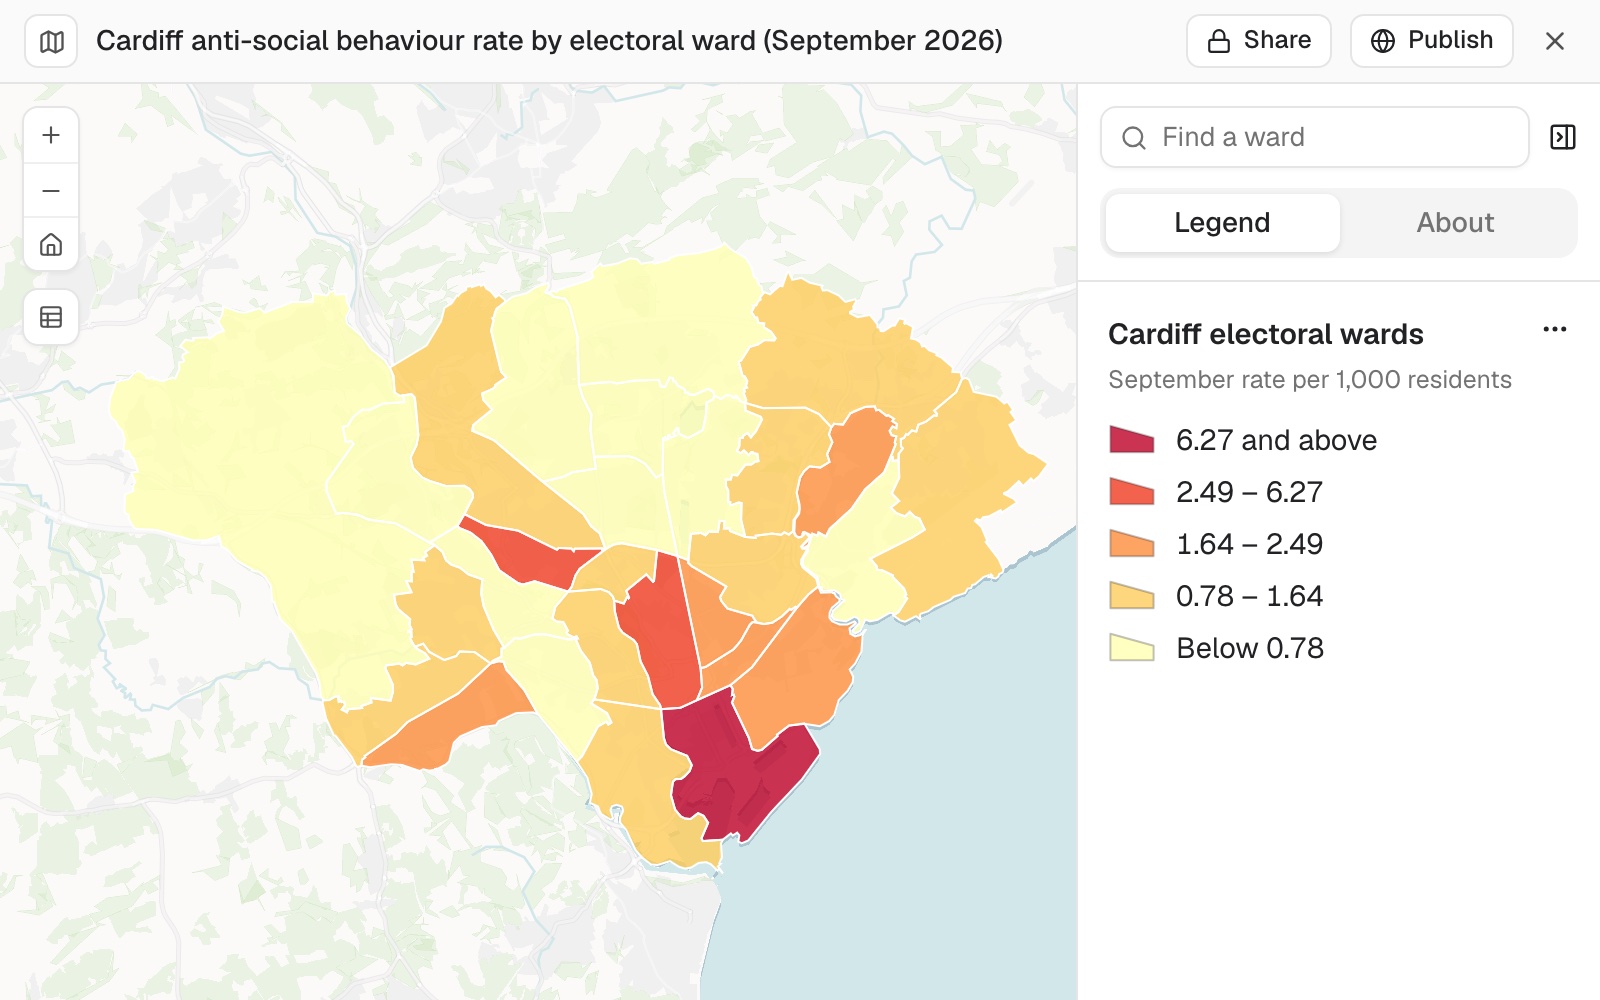 Example: September's anti-social behaviour per 1,000 residents in each of Cardiff's 28 electoral wards, from police.uk records and Census 2021 residents. Butetown, at 6.27, is in the top class on its own.
A rate for a group of areas is worked from the totals, not averaged from the areas' own rates. A region's collection rate is everything collected over everything collectable across its councils, so a small council's rate does not count for as much as a large one's. An average of the rates would be a different number, and usually the wrong one.
A count is not a measure of how well served an area is. In the example, a ward with 97 stops had a lower share of residents within a short walk of one than a ward with 6. To ask who can reach a stop, see Find who and what is within reach and the guide Walking access by area.
Compare areas fairly, per head
Wards differ in size and population, so a raw count favours the big ones. Divide by population, and Mapstack fetches the census figures if you do not have them.
Divide each ward's stop count by its Census 2021 population and give stops per 1,000 residents
Length and coverage of lines and areas
Road or cycle lane per district, the share of each parcel in a flood zone. Bring the lines or areas to measure, such as roads, rivers or flood zones.
Lines and areas are shared out by the part inside. A feature that crosses an edge is cut, and each piece takes a share of its values in proportion to its length or area. That is exact for length and area themselves. For a value that is not spread evenly, such as traffic on a road that is busier at one end, the shares are an estimate.
A feature on a shared boundary counts in each area it touches. A road along the line between two wards belongs to both.
It will measure one layer against another, not only inside your areas. The part of one layer that falls within a distance of another (heath within 50 m of conifer forest) comes back as its own measured strip. So does the area of each kind inside a single boundary, by type and as a share of the whole, and the edge-to-edge distance from each of your areas to the nearest feature of another layer, with that feature named. Each area's own perimeter comes with its area when you ask for it.
Total the length of lines in each area
A road or river that crosses an edge is cut there, and each area gets the part inside it.
What is the total length of road in each district, in kilometres?
Find how much of each area is covered
How much of each parcel is covered by the flood zone, as a percentage?
Census figures for your areas and places
The population within a mile of each store, or the households in each sales territory. Ask for the figures you want in plain words. You get one new column for each, on your areas, or on rings or travel areas around your places.
Census figures for split areas are estimates. Census figures are published for small official areas, and your shapes never line up with them. Where a small area lies partly inside your shape, its count is shared out by how much of it lies inside (GIS people call this apportionment). That assumes people are spread evenly across the small area. In towns, with small areas, it is close. In the countryside, where one small area can hold a village and a lot of empty fields, it can be some way off.
Not every country publishes every figure. The UK census, for example, does not include household income. If a figure is not published for your place, Mapstack says so, and asks before using a related measure in its place. See Data Mapstack can find for you.
It asks before a large job. Travel areas around many places get a card first, saying what share of your allowance it will use, with Go ahead and Don't run it.
Add census figures to your own areas
Ask in plain words (population, households, age). Mapstack finds the measure in its catalogue of official statistics for the place, with the year it comes from.
Add the number of households to each of our sales territories
Add census figures for a ring or a drive time around each place
Give a distance for a straight-line ring, or a travel time and how people travel: drive, truck, cycle or walk. You get the rings or travel areas back unless you ask to keep your places as points.
What is the population within 1 mile of each store?
What is the median age within a 10-minute drive of each clinic?
Add the population within 1 km to each store as a column, and keep the stores as points
How a figure is worked out
Every count here rests on choices about edges, overlaps and gaps. You will be asked to defend these numbers, so this is what Mapstack does with each.
Where a rule is yours to set, say it once and Mapstack holds to it exactly, and tells you which rule it used.
Nested or ranked zones need you to say how a record should count. A floodway inside a wider flood area, wind bands inside each other: give the order of severity and each parcel or site is counted once, in the worst zone it touches, so the totals across the zones add up to the real total. Ask instead for it to count in every zone it touches and it will, and the totals will overlap on purpose.
A sliver is left out when you say so. Ask for a minimum overlap (count a parcel only where at least a tenth of it is inside) and the edge cases that merely graze an area are dropped, and the result says they were.
An area missing from your table counts as zero, not as blank. If your figures cover 360 areas and the boundary set holds 494, the other 134 are areas with none, and shares are worked out across all of them.
An area drawn in several pieces is one area. A district that comes as three polygons is counted once, and Mapstack says so when it finds one.
The sea is left out of a place's outline, so a coastal county's figures are not diluted by water that holds nobody.
Records with no location are counted and named, not dropped. You get the number that could not be placed and, on asking, the list of them with the reason. A record placed only roughly (to a province, or to the street rather than the building) keeps its precision beside it, and Mapstack flags the ones where that roughness could change the answer.
See how a number was reached
Ask. Mapstack states the rule it used, and will change it: which zone an overlap counted in, what minimum overlap it applied, what it did with rows it could not place.
How did you work out the rate for each region?
Count a parcel only if at least 10% of it is inside the zone
Which rows could you not place, and why?
Hexagons, squares and other grids
Equal cells make a hexagon map of density possible where official areas vary too much in size to compare.
Every grid cell is labelled. Each one gets a GRID_ID, such as A-10, and its area in square kilometres, so you can refer to cells by name.
A cell can hold a count of how many different kinds it has, not only how many records: the number of distinct species recorded in a square, say, beside the record count. A plain rate per cell (one column over another) comes back as its own column to map.
Ask for the grid to be cut to a boundary and only the cells inside it are kept; otherwise the grid fills the rectangle around your data and spills past an irregular edge.
A distance is the width of a cell. For a hexagon it is the width across its flat sides, so a 700 m hexagon covers about 0.42 square kilometres.
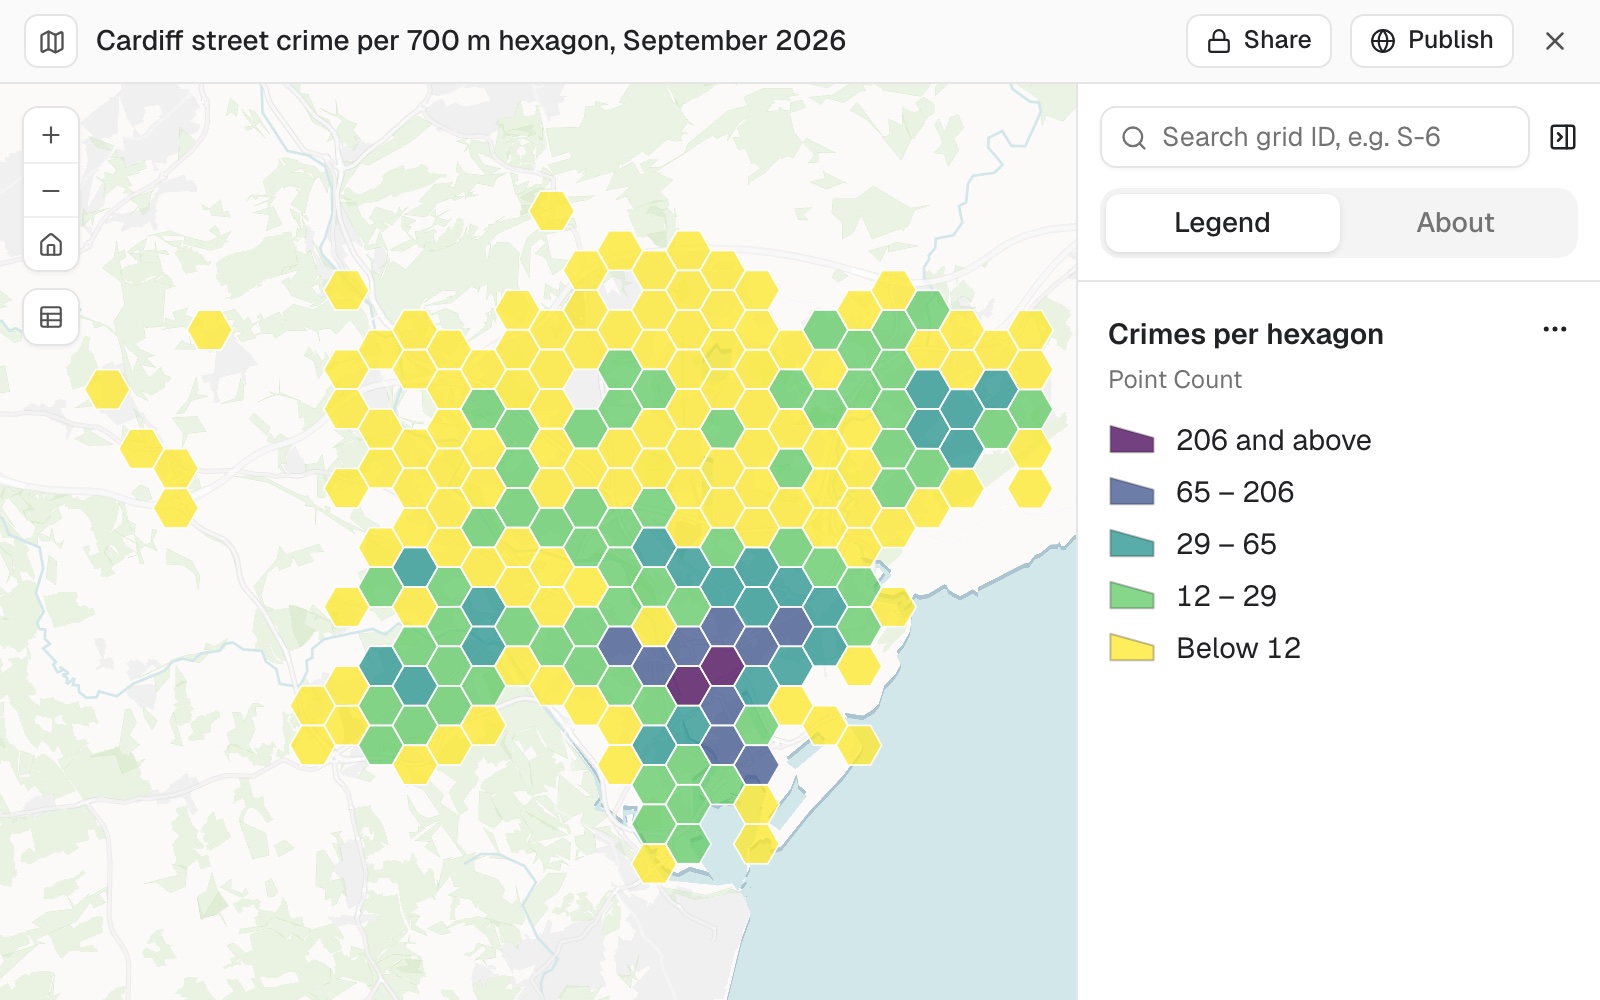 Example: police.uk's 3,738 street crimes in Cardiff in September 2026, counted into 700 m hexagons and kept only where a cell holds at least one. The 218 cells run from 1 crime to 224, in cell S-6 in the city centre.
Make a grid of hexagons, squares or H3 cells
Give the size with its unit: without a unit, size is read as square miles. H3 is the global hexagon system used to join data from other sources. The grid fills the rectangle around your data, so it spills past an irregular boundary: keep only the cells that touch your data, or clip the grid to the boundary (see Combine and reshape data).
Make a grid of 1 square kilometre hexagons over these incidents
Cover the study area with 500 m squares
Make H3 cells at resolution 8 over these stores
Make 250 m hexagons over these stores, keeping only the cells that touch a store
Count into a grid
Equal cells compare like with like. Ask for the grid and the count in one message, or count into a grid you already made.
Count the active bus stops in each 500 m hexagon across Liverpool
Make 700 m hexagons over September's crimes in Cardiff, keeping only the cells that touch a crime, then count the crimes in each and map them
Reference
| Statistics, per numeric column | Sum, mean, minimum, maximum, standard deviation, count, range and variance |
| Coverage | The share of each area covered, when the features are areas |
| Breakdown | By any category column, with the least and most common category per area |
| Areas, lengths and distances | Measured on the WGS 84 ellipsoid, not on a flat projection, so they hold anywhere on the earth. A planar measurement in a projected coordinate system can differ slightly |
| Very large results | See Sizes and limits |
| How a figure is reached | |
|---|---|
| A rate for a group of areas | Worked from the totals, not averaged from the areas' own rates |
| A record in more than one area | However you say: once in the worst area it touches, given the order of severity, or in every area it touches |
| Minimum overlap | None unless you ask; ask for one and slivers below it are dropped and reported |
| An area absent from your figures | Counted as zero, and included in shares |
| An area drawn in several pieces | Counted once |
| The sea in a place's outline | Left out |
| Records with no location | Counted and reported, never dropped silently |
| A roughly placed record | Keeps its precision, and is flagged where that could change the answer |
| Census figures | |
|---|---|
| Where they come from | Mapstack's catalogue of official statistics. What it holds varies by country |
| Shape around places | A straight-line ring, or a travel area by drive, truck, cycle or walk |
| Ring distance | 1 mile unless you say otherwise; any distance unit on asking |
| Travel time | In minutes, along OpenStreetMap roads and paths, with no live traffic |
| What comes back for places | The rings or travel areas, unless you ask for your places |
| Grid setting | What you can ask for | If you don't say |
|---|---|---|
| Shape | Square, hexagon, transverse hexagon, triangle, diamond or H3 | Square |
| Size by | The area of a cell, or a distance | Area |
| Size | A number, with its unit | 1 square mile |
| H3 resolution | 0 to 15 | 8 |
| Only cells that touch the data | Yes or no | No |
What it can't do
- Count or measure from imagery, such as land cover read from a satellite image. Analysis works on datasets.
- Give exact census counts where small areas are split. Those figures are estimates.
- Add a figure the statistics catalogue does not hold for that place.
Common questions
What does the number that fell outside my areas tell me?
Whether your points and your areas cover the same ground. In the example the stops file covered all of Merseyside and the wards only Liverpool, so 5,173 of the 7,079 active stops fell outside. If your points should all be inside, open the points dataset and look at its map before you count.
Does a high count mean an area is well served?
Not on its own. In the example, a ward with 97 stops had a lower share of residents within a short walk of one than a ward with 6. To ask who can reach a stop, see Walking access by area.
How close are census figures for my own areas?
In towns, close. Where a small area lies partly inside your shape, its count is shared out by how much lies inside, assuming people are spread evenly across it. In the countryside that can be some way off, so treat rural figures as estimates or use a larger ring.
Which grid shape should I use?
Square is the default. Hexagons are common for density maps, and H3 lines up with other data already in H3 cells. Say the shape and the size with its unit: '1 square kilometre hexagons' or '500 m squares'.
How do I check the counts?
As you would a colleague's: check how many points the filter kept and how many fell outside, then look at the areas with the highest and lowest counts. Ask where any figure came from, for example 'How did you get the count for the ward with the most stops?', and Mapstack shows the steps behind it.