

Map a spreadsheet: addresses, coordinates or place names
Give Mapstack a spreadsheet of addresses, coordinates or area names, tidy or as exported, and it puts every row in its place, ready to map.
A spreadsheet holds words and numbers, and a map needs a position for every row. Mapstack reads what your sheet holds and finds that position the right way for it:
- Addresses are looked up, one by one, to find where each is. GIS people call this geocoding.
- Latitude and longitude are used exactly as they are. There is nothing to look up.
- Area names or codes (counties, postcode districts, states) are matched to a set of boundaries, so each area can be coloured by your figures. GIS people call this a table join, and the map it makes a choropleth.
What you get back is your sheet as a dataset: every row you gave it, now with a place. A dataset is yours to open, check and edit, and maps are made from it. The sheet does not need tidying first: title rows, totals and unnamed columns are expected. Customers, sites, branches, deliveries, members, premises to inspect, sensors and survey points, sales by county, cases by state: once the rows are placed you can colour them by one of your columns, ask questions about them, or put them beside other data.
Two real files run through this page, one for addresses and one for coordinates. The asks for areas and for messy files are examples of the kind of thing to say.
- Who can use it
- Free, Creator and Creator Max
- You provide
- A spreadsheet with one row for each place or area
- You get
- A dataset of points or areas, and a map if you ask for one
Map a list of addresses
The example here: the site list of Pretzel Hatch, the kiosk chain these docs return to, with each site's name (the London station it trades at), its postcode, its format and its weekday covers. The stations and postcodes are real; the company and its figures are made up. They became 149 points.
How the address lookup works. Rows with an address, in one column or several, are looked up. Mapstack sends each address to a geocoding service, which searches for places whose name matches and returns the best one it finds. It is the same judgement you make reading an address, done for every row, and it can go wrong in the same ways.
Why an address can land in the wrong place. Street names repeat. There is a Bold Street in Liverpool and another in Southport, and a Castle Street in most towns. When the rest of the address does not settle which one is meant, the service can pick the wrong town, and the address in the file can be right while the match is not. A point far from the rest is the one to check, and it can just as well be right: in the example the one site outside Greater London, Whyteleafe, is just over the line in Surrey, where that station is.
How sure it was. Every looked-up row gets a Geocode Match Quality: premises, street or area. It tells you how precise the match is, not whether it is right. An address matched to the wrong town's street still says "street". Rows matched only to an area are placed at the middle of it and spread a little so they do not sit on top of one another.
What helps the lookup. The town and postcode on every row: they are what tell two streets of the same name apart. The country, if your file does not make it obvious. If your places are all in one area, say so in your message ("these are all in London"): Mapstack uses it to narrow every search. If the area is unclear, Mapstack asks you before it goes on.
A point in the wrong place can be put right. Ask, or move the point yourself in the dataset.
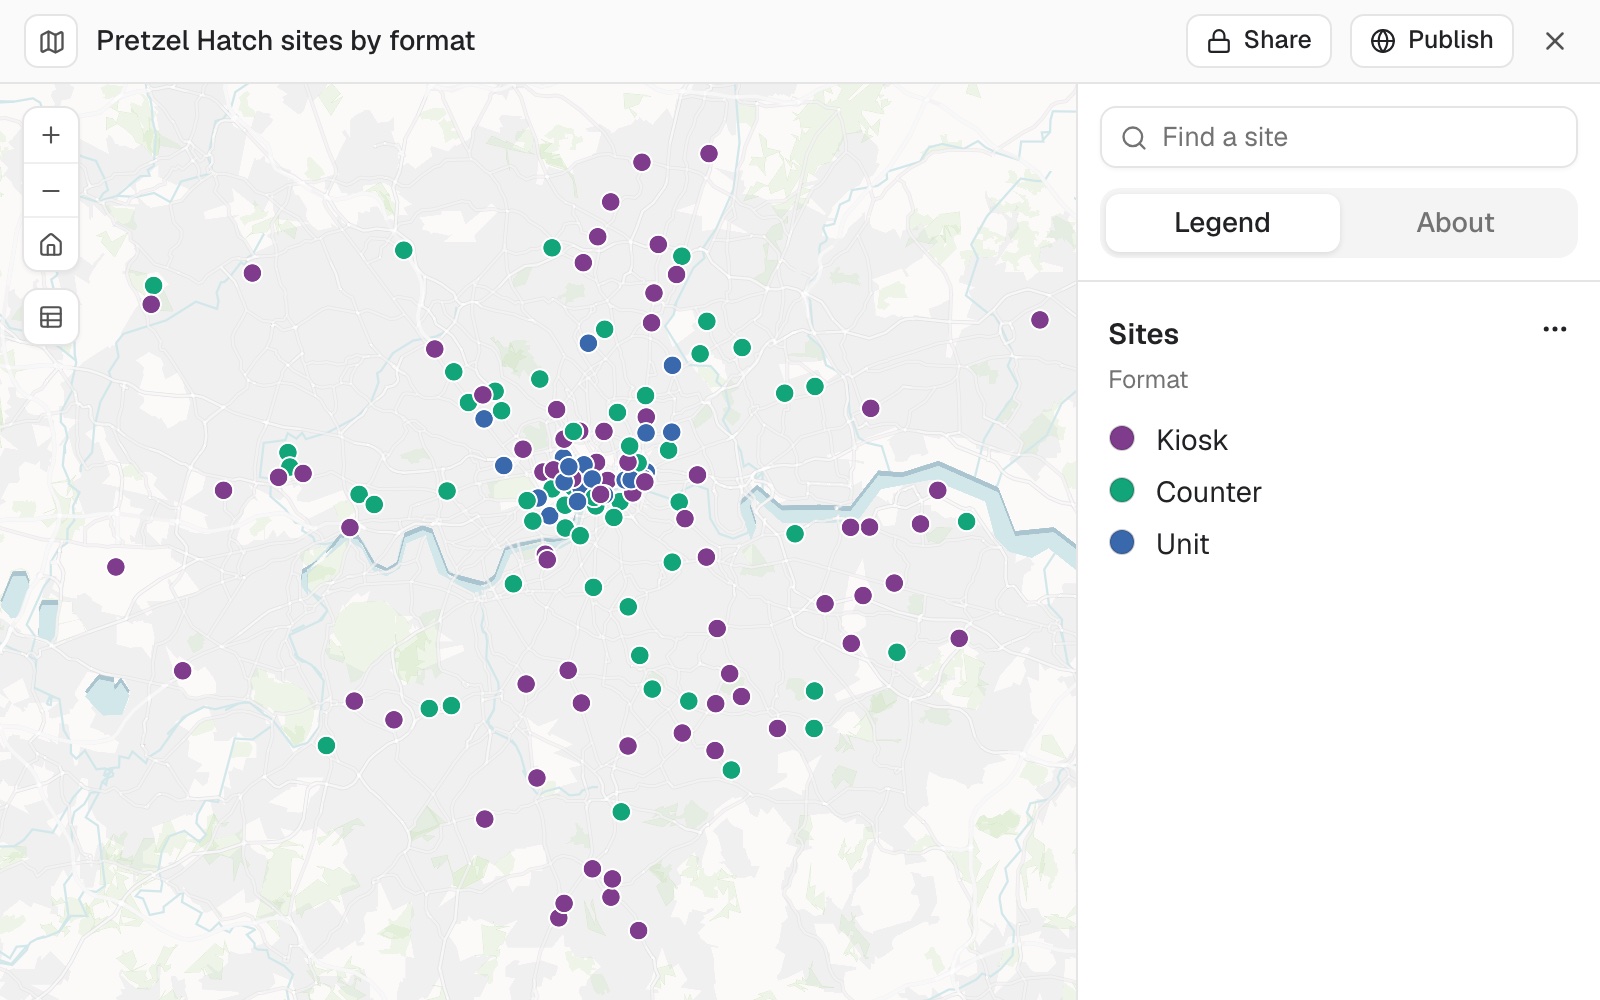 Example: 149 sites mapped from their postcodes and coloured by format. The point at the bottom, Whyteleafe, is the one to check.
Looking up addresses uses part of your allowance. See Your allowance.
Put a list of addresses on a map
Attach the spreadsheet and say what you want in the same message. If you say exactly what the map should show, Mapstack goes ahead without asking first.
Map our sites and colour them by format
Check where the addresses landed
Two questions an experienced user asks after every geocode. The first finds the places that could only be placed roughly. The second checks every point against the boundary of where they should be: Mapstack fetches that boundary itself.
Which of our sites were only matched to an area, not to the premises or the street?
Are any of our sites placed outside Greater London?
Map rows with latitude and longitude
The example here: every bus stop and other public transport access point in Merseyside, 8,018 rows from the Department for Transport's NaPTAN register, each with a stop name, its status and its latitude and longitude. They became 8,018 points.
It uses the coordinates in your file. Rows that carry coordinates are placed from them, without an address lookup, even when they have an address too. Mapstack reads them in three forms: two columns (latitude and longitude, or eastings and northings), one column holding both numbers ("52.6252, -1.1190"), or a column of WKT points ("POINT(-1.599807 54.96203)").
Eastings and northings are converted. British National Grid, a UTM zone or another grid is converted to latitude and longitude. Mapstack works out the system from what you said, from a column name such as easting_UTM13N, or from the country you named. When the numbers fit more than one system and nothing settles which, it asks you, showing where each one would put the points. When it judged the system without being told, it says so with the result.
A row with no readable coordinates is left off and counted. It is listed as unmapped with its values; it is not placed from its address instead.
Put rows with latitude and longitude on a map
You do not need to say which columns hold the coordinates: Mapstack finds them from the values.
Map the active bus stops in this file
Use your points with other data
Points with exact positions are ready for counting, measuring and joining straight away. Attach the other file in the same message, or name one from your Library.
Count the active bus stops in each Liverpool ward and shade the wards by the count
Colour areas by your figures
A table with one row per area, and a column of area names or codes, is matched to boundaries. A full postcode on each row of a customer list is read as an address, and each row becomes a point; a table with one row per postcode district and a figure for each is read as areas. Give the country, in your message or in the file: it narrows the search for boundaries.
It always asks: areas or points? A table keyed by areas can be drawn either way, so Mapstack asks before it makes anything, with Areas and Points as the answers. It does not recommend one.
Matching names to boundaries is a judgement. The names in a table are often not the official ones: a short form, an old name, a spelling. Mapstack looks for the boundary set that fits your column, at the level your areas are at, and matches your names or codes to its own. It will not join your table to a set from a different level because the number of areas happens to be close. When every area matches, the dataset is made. When 90% or more match, it is made and the result names the areas that found no boundary, so you can see what is missing. Below 90%, Mapstack first tries to match the remaining names; if that still leaves fewer than 90%, nothing is made and it asks how to go on: Use a different boundary set, One point per area, or Map only the areas that matched (the rest are listed). Total rows such as "All councils" are not counted. A low match usually means the wrong country or the wrong level of area, so say which. When there is no boundary set, Mapstack asks what should happen: Use a boundary dataset (one you bring, or one found another way), or One point per area.
A count is not always the fairest measure. Big areas tend to have more of everything. If your table has a population column, ask for the figure per person as well.
Colour counties, postcode districts or regions by a figure
Attach the table and say what to show. Name the country, and the kind of area if the names alone could be read two ways.
Make a map of sales by county for the board. The counties are in Kenya.
Shade the postcode districts by the number of members in each
Join your table to your own boundaries
If the areas are your own (sales territories, service zones), bring the boundaries as a GIS file in the same message, or name a boundary dataset in your Library.
Join this table of sales by territory to the territory boundaries in my library, matching on the territory code
Years and other periods
A table can hold one row for each area and period. Up to 12 periods become columns without a question. With more, Mapstack asks which the map should show (up to 12), shows the share of areas with a value in each, and suggests the newest period that most areas have. Rows that are totals for the whole table (Total, All, National) are set aside first, so they do not count as an area.
Step through the years
If each area appears once for each year or period, the periods become columns on that one area, so the map can step through them.
Map this table of population by state for 2015 to 2024 so I can step through the years
Messy exports, unnamed columns and workbooks
It finds the table in a messy file. Title rows, notes, repeated headings, section labels and total rows are read for what they are and kept out of the records: a total counted as a place would distort every figure on the map. Commas, semicolons, tabs or pipes as separators, a byte-order mark, older text encodings (including Shift-JIS and EUC-KR) and stray quote marks are all read. Number columns that are really dates are read as dates where the reading is clear.
It proposes names for unnamed columns, and you confirm them. For each column with no usable heading it shows sample values and a proposed name: keep it, or give the right one. A column is never published under a placeholder such as col_1. Up to 5 unnamed columns are settled this way; with more, the file needs its headings added. If you know the missing names, say them in your message, left to right.
One sheet is one dataset. When more than one sheet holds places, Mapstack asks Which worksheet should be processed? and lists the sheets by name.
Map a file just as it was exported
Title blocks, notes, totals and a second sheet of workings can stay. If you know the file has them, saying so does no harm.
Map the offices in this file. It has a title block at the top and totals at the bottom.
Name columns that have no heading
If you name the columns in your message, left to right, Mapstack uses your names and does not stop to ask.
Map this export. The columns are store name, address, city, postcode and weekly sales, in that order.
Pick the sheet of a workbook
Name the sheet in your message and Mapstack uses it. If you do not, and more than one sheet holds places, it asks.
Map the branches in this workbook. Use the sheet called Branches 2025.
The dataset, its account and the map
You get a dataset with one point for each row, or one area for each area in your table, holding your columns (any others you keep come along with each row) and the account of how it was made. Open it from its card in the conversation: its Table shows every row, and its Details show what it holds and how it was made. If you asked for a map, a count or a comparison, you get that too, made from the dataset.
It shows its working. The account says how many rows went in, how many came out and how many were left out; for areas, how many matched out of the total, which did not, and how your names were matched; for a messy file, what was skipped or renamed. Rows that do not match are listed, never dropped quietly. When addresses are looked up, Mapstack adds Latitude, Longitude and Geocode Match Quality columns, and may rename columns: "Name" became "Business Name".
Change how the map looks
Say what should change. Anything you do not mention stays as it was.
On the map, make the rating 3 businesses red so they stand out
Reference
| File types | CSV and Excel (.csv, .xlsx, .xls), or rows pasted into a message: see Upload a file |
| Coordinates | Two columns (degrees, or eastings and northings), one column with both numbers, or WKT points |
| Columns added to looked-up addresses | Latitude, Longitude and Geocode Match Quality |
| Match quality | Premises, street or area |
| Share of areas that must match | All, to be made as it is. 90% or more: made, with the unmatched areas named. Below 90%: you choose how to go on |
| Periods turned into columns without asking | 12, and up to 12 picked when asked |
| Title rows and notes above the table | Left out. In a CSV, up to 20 lines above the table are allowed for |
| Columns with no name | Up to 5 settled by asking you |
| Separators in a CSV | Comma, semicolon, tab and pipe |
| Text encodings | A byte-order mark and older encodings, including Shift-JIS and EUC-KR |
Which boundary sets exist depends on the country and the kind of area. Very large files and long address lists: see Sizes and limits.
What it can't do
- Guarantee every address lands in the right place.
- Draw lines or areas from a column of WKT in a spreadsheet. It reads WKT points only; for lines and areas, bring a GIS file.
- Read eastings and northings written together in one column. Put them in two columns.
- Combine rows when an area repeats for something other than a period, such as an age band, a product or sex. Give each area one row (or one row for each period) and attach it again.
- Average or add up several periods into one figure when it asks which periods to show.
- Draw areas it has no boundaries for, unless you bring them or choose one point per area.
- Add rows up into larger areas as it reads the file.
- Settle more than 5 unnamed columns by asking, or guess what an unnamed column means when its values do not show it.
- Merge several sheets into one dataset as it reads the workbook.
- Read a location typed into a cell with other text (a time, a name, a note), or a file whose rows are not one record each.
- Take a file from a Viewer seat.
Common questions
Which addresses should I check?
Ask Mapstack to find them: 'Are any of our sites placed outside Greater London?' A point far from the rest can be right, or matched to a street of the same name in another town: look at its address to tell which. If many are off, add the town and postcode to every row and attach the file again, saying where the places are.
Does "premises" mean the point is right?
It means the match was precise, to a building. It does not mean it was the right building. Check points that sit outside the area you expect, whatever their match quality.
How do I move a point?
Ask. Or edit the dataset yourself: open it on its Map tab, select the point, choose Edit feature, then Move, drag it to where it belongs and select Save. Maps made from the dataset show the change. See Edit your data.
My coordinates are eastings and northings. Can I use them?
Yes. Mapstack converts them to latitude and longitude. If it cannot tell the system from the file or from the country you named, it asks. You can say it up front: 'These are in British National Grid, EPSG:27700.'
How do I check my areas matched?
Read the account that comes with the dataset: how many of your areas matched out of the total, which did not, and how your names were matched. Old names and short forms such as "Yorks" are the usual reason an area does not match: fix them in your file and attach it again.