

Compare two catchments: who they share, and what a new site would take
Measure who lives within reach of two sites, how many they share, and how a third site would split the people between them.
Best for
Anyone weighing up sites that draw on the same people: retail and property teams asking how much a new store would eat into an old one, health planners comparing two clinics, consultants preparing a site report. You end up with each site's catchment measured, the overlap counted, a map of both, and an estimate of how a new site would split the people between them.
The example in this guide compares the two IKEA stores in Sydney, Tempe and Rhodes, then tests a third at Westfield Parramatta. Nothing is attached: Mapstack finds the stores as places, draws the drive-time catchments on the road network and takes the population from the Australian Bureau of Statistics' 2021 Census. It uses 30 minutes, a usual reach for a destination store such as IKEA. With your own sites, keep the shape of the asks and change the names and the time.
What you need
- The sites, by name and town, by address, or as a file. Mapstack can find well-known places itself.
- A catchment rule: a drive or walk time, or a distance.
- A Free, Creator or Creator Max seat.
Before you start
- A catchment comparison counts people, not sales. Population and census profiles come with the product. A sales figure needs your own store sales, or spending data you bring.
- Say the unit for people. Mapstack chooses how to share census figures out across a catchment edge, and says which it chose. If you need a particular level (an SA2, a census tract, an output area), name it.
- Say what each site's pull is. A gravity model needs a weight for each site, such as floor space. Left open, Mapstack treats every site as equal and tells you so.
The prompt
Compare the 30-minute drive catchments of IKEA Tempe and IKEA Rhodes in Sydney. How many people live in each, and how many live within 30 minutes of both? Count people by mesh block.
What to expect
It finds the sites and draws the catchments
Mapstack looks up the named stores, draws a 30-minute drive-time catchment around each on the road network (the area reachable by car in that time, without live traffic), and works out the area they share.
It counts the people and compares them
Census figures come by area, and areas rarely line up with a catchment edge. Mapstack says how it handled that. The example names the mesh block, the smallest area the Census publishes: a block counts when its centre is inside the catchment, so the edge is close to exact.
In the example: about 1.99 million people within 30 minutes of Tempe, 2.23 million of Rhodes, and 1.29 million within 30 minutes of both, which is 65% of Tempe's catchment and 58% of Rhodes'. Between them the two stores reach 2.93 million people. Results vary with the routing and the census level, so read them as estimates and keep the method with the numbers.
You put both on one map
Show both catchments and the overlap on one map, with a table side by side.
The map shows each catchment and the shared area in their own colours, with the two stores marked. The figures for each catchment are in the map's table and pop-ups.
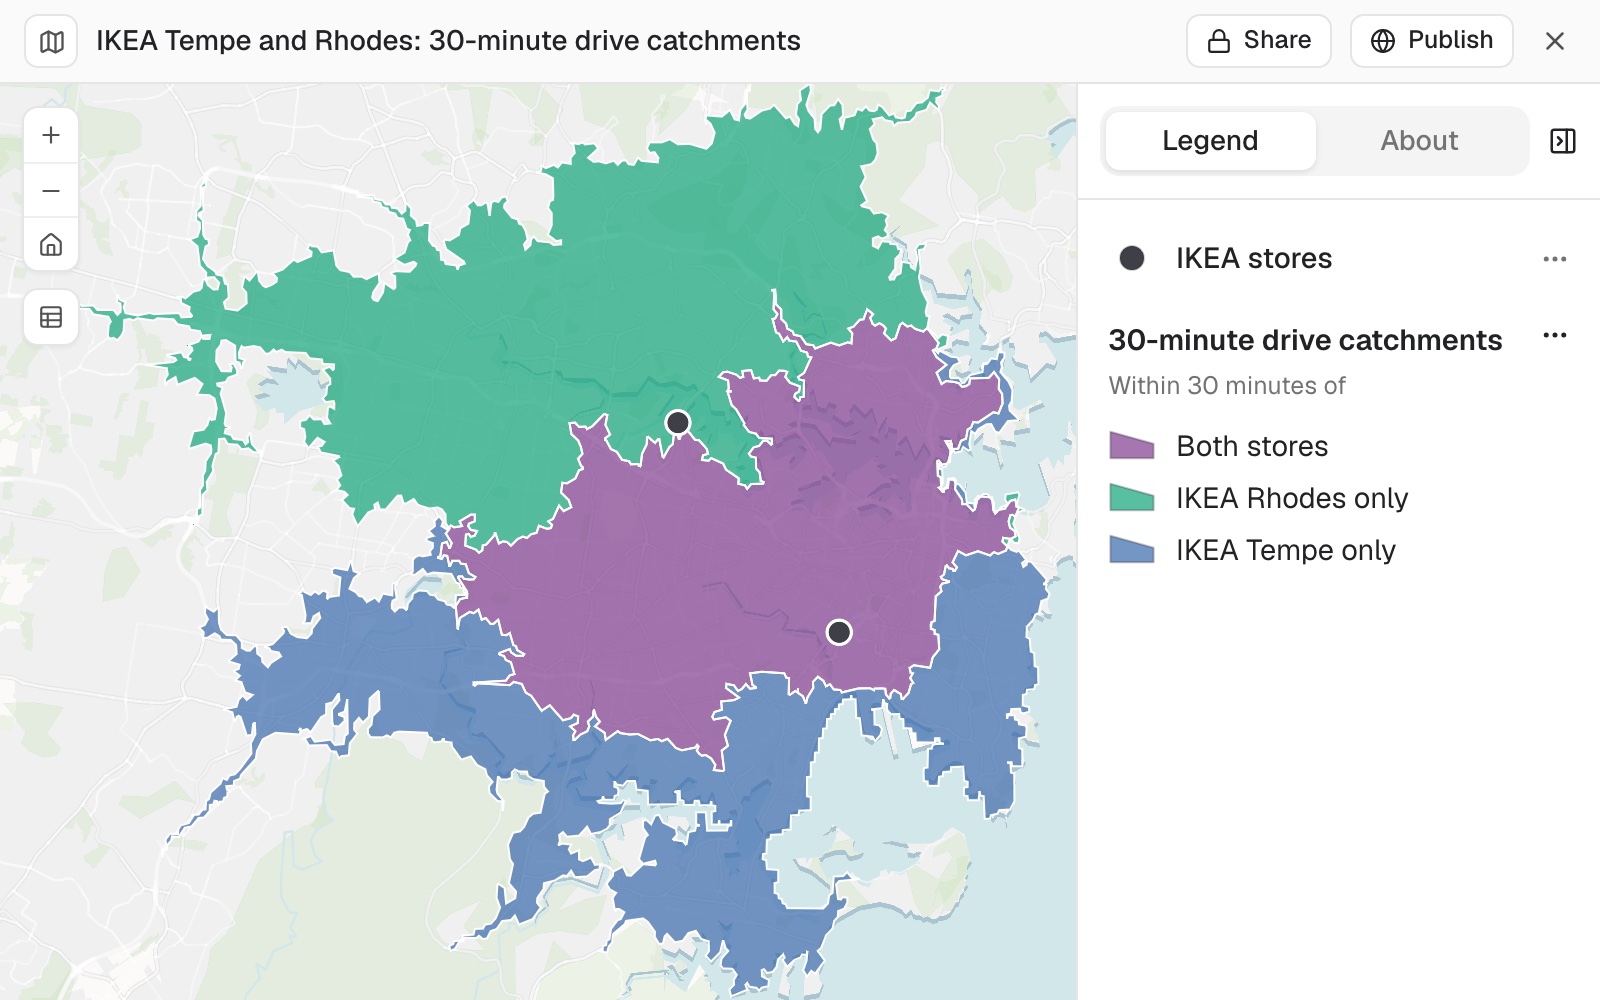 Example: the 30-minute drive catchments of IKEA Rhodes (green, north and west) and IKEA Tempe (blue, south and east), with the area within 30 minutes of both in purple.
You test a new site with a gravity model
A gravity model (the Huff model is the common one) shares the people in each small area between the sites by how attractive each site is and how far away it is: nearer and bigger wins more. Ask for one, name the small area it counts from so each person is counted once, and ask for the assumptions:
If a third store opened at Westfield Parramatta, how many people would it pull from each store? Use a gravity model with each SA2 as an origin, using its own population and its drive time to each of the three stores, count each person once, and give each store's share of the people within 30 minutes of any store, before and after Parramatta opens. Say what you assumed about each store's pull.
Mapstack states what it assumed: in the example, equal pull for all three stores, and attraction falling with the square of drive time. It uses every SA2 within 30 minutes of a store and gives tables that add up. Before Parramatta, the 2.89 million people in SA2s within 30 minutes of Tempe or Rhodes split almost evenly between them, 51% and 49%. After, Parramatta takes about 874,000 of them: Rhodes loses 523,000 (37% of the people it had) and Tempe 351,000 (24%). Parramatta also brings in 648,000 people who had no IKEA within 30 minutes before. Because this run counts a whole SA2 when its centre is within 30 minutes, its totals differ a little from the first answer's.
Make it your own
What would we need to turn that into a sales forecast?
Common questions
Can I use a different time, a walk, or a distance?
Yes. Say the time and the mode, or ask for a distance instead. Drive times follow the road network, without live traffic.
What if a site name matches more than one place?
Give the address, or ask which address Mapstack used. A store or clinic name can match more than one place.
What does the gravity model assume?
What you leave open, Mapstack decides and states: in the example, equal pull for every store, and attraction falling with the square of drive time. To change it, give each site's pull, such as floor space, and the unit to count people from, for example "each SA2 as an origin, counting each person once".
Why do two answers give different totals?
Each method draws the edge differently: one counts small areas such as mesh blocks whose centre is inside the catchment, another counts a whole SA2 when its centre is inside, and a third shares an area's figures by the part of it inside. Ask which was used, and keep to one for anything you compare.
Can it forecast sales?
Not from people alone: the model shares out people, not money. A forecast also needs spending on the category per area, your share of that spending, each store's floor space or format, and your stores' own sales to calibrate it. Mapstack can add census income by area itself; the rest is yours to bring.