

Join two tables on a shared ID and see what didn’t match
Bring the columns of one table onto another by a shared ID, count what matched on each side, and map the joined result.
Best for
Anyone with two tables that share an ID: an asset register and an inspection export, a customer list and a sales report, a site list and a survey. You end up with one dataset carrying the columns of both, a count of what matched and what did not on each side, and a map.
The example in this guide uses two real public tables. The first is the Department for Education's register of Manchester schools (Get Information About Schools, downloaded 11 November 2026): 475 establishments, open and closed, each with its URN (the unique reference number every school in England has), type, status, phase, pupil numbers, address and a British National Grid easting and northing. The second is Ofsted's latest inspection results for state-funded schools as at 30 September 2026 (gov.uk), cut to Manchester: 188 schools keyed on URN, with 77 columns. 26 of them have grades from the new report cards introduced in November 2025, others only the older 1 to 4 grade, and some only the outcome of an ungraded inspection. Every ask below was sent with those two files, and results vary in the detail from one run to the next.
What you need
- Two tables (.csv, .xlsx or .xls) that share a column holding the same ID on both sides.
- A location on at least one of them, if you want a map: coordinates or addresses.
- A Free, Creator or Creator Max seat.
Before you start
- Say which table keeps its rows. "Keep every school on the register" makes the register the side that keeps its rows; the other supplies columns.
- Know what each table is for. An export of the latest results for state-funded schools will never hold independent schools or closed ones. That is why rows go unmatched, before anything is wrong.
- Ask for the match counts. They are the first check that the join worked.
The prompt
Two tables attached: the DfE register of Manchester schools and Ofsted's latest inspection results. Join them on URN, keep every school on the register, and put the latest inspection outcome on the schools map. Tell me how many matched and how many didn't on each side.
What to expect
Each table becomes a dataset
Mapstack reads each file into a dataset of its own and places the rows that have a location. The register's eastings and northings are converted on the way in. In the example 468 of the 475 schools were placed; the 7 left off were closed schools with neither coordinates nor a postcode.
It joins on the ID and counts both sides
An attribute join matches rows on a shared value, here the URN. Keeping every school on the register makes it a left join: schools with no inspection row stay in the result with empty inspection columns.
In the example all 188 Ofsted rows matched a school on the register, and 287 register schools had no Ofsted row. Both figures agree with the files.
You find out why rows didn’t match
Unmatched rows are where the questions are. Ask about them by name, and say which column decides what you mean:
Which open schools have no inspection result, and why might that be?
In the example the first answer was 126, too many: it had counted every school without an old 1 to 4 grade, including closed schools and some that had an inspection result. A named check put it right:
That count looks wrong: Dixons Newall Green Academy and Meade Hill School both have an Ofsted result. Use the register's EstablishmentStatus column and count only schools whose status is Open. How many open schools have no inspection result, and which are they?
The second answer, 38 of the 222 open schools, matches the files: 35 with no Ofsted row (22 independent schools, 6 colleges and universities, 5 special post-16 providers, a 16 to 19 free school and a cooperative college) and 3 new free schools listed by Ofsted but not yet inspected. Mapstack also explained the gaps: independent schools are often inspected by another body, and a school that opens or converts to an academy gets a new URN and may not yet have been inspected under it.
You make one column the map can colour by
When the other table holds the same thing in several columns, ask for one column that takes whichever applies, and say how to choose:
Some schools have the new report-card grades, some only the old 1 to 4 grade, and some only an ungraded inspection. Make one column for the map with each open school's latest outcome: the report card's Curriculum and teaching grade where it has one; otherwise its latest grade, using the quality of education grade where an inspection gave no overall grade, and the grade an ungraded inspection says the school keeps. Colour the open schools by it from best to worst, report-card grades first.
The report card has no single overall grade, which is why the ask names one area: Curriculum and teaching is the nearest successor to the old quality of education grade. The other areas stay in the pop-ups.
Mapstack makes a new dataset with that column and a second one saying where each value came from, and restyles the map. In the example, of the 222 open schools, 25 take a report-card grade, 138 an older 1 to 4 grade (22 of them the quality of education grade), 21 have only an ungraded inspection that names no grade, such as "Standards maintained", and 38 are uninspected, the same 38 as before. Every count agrees with the files.
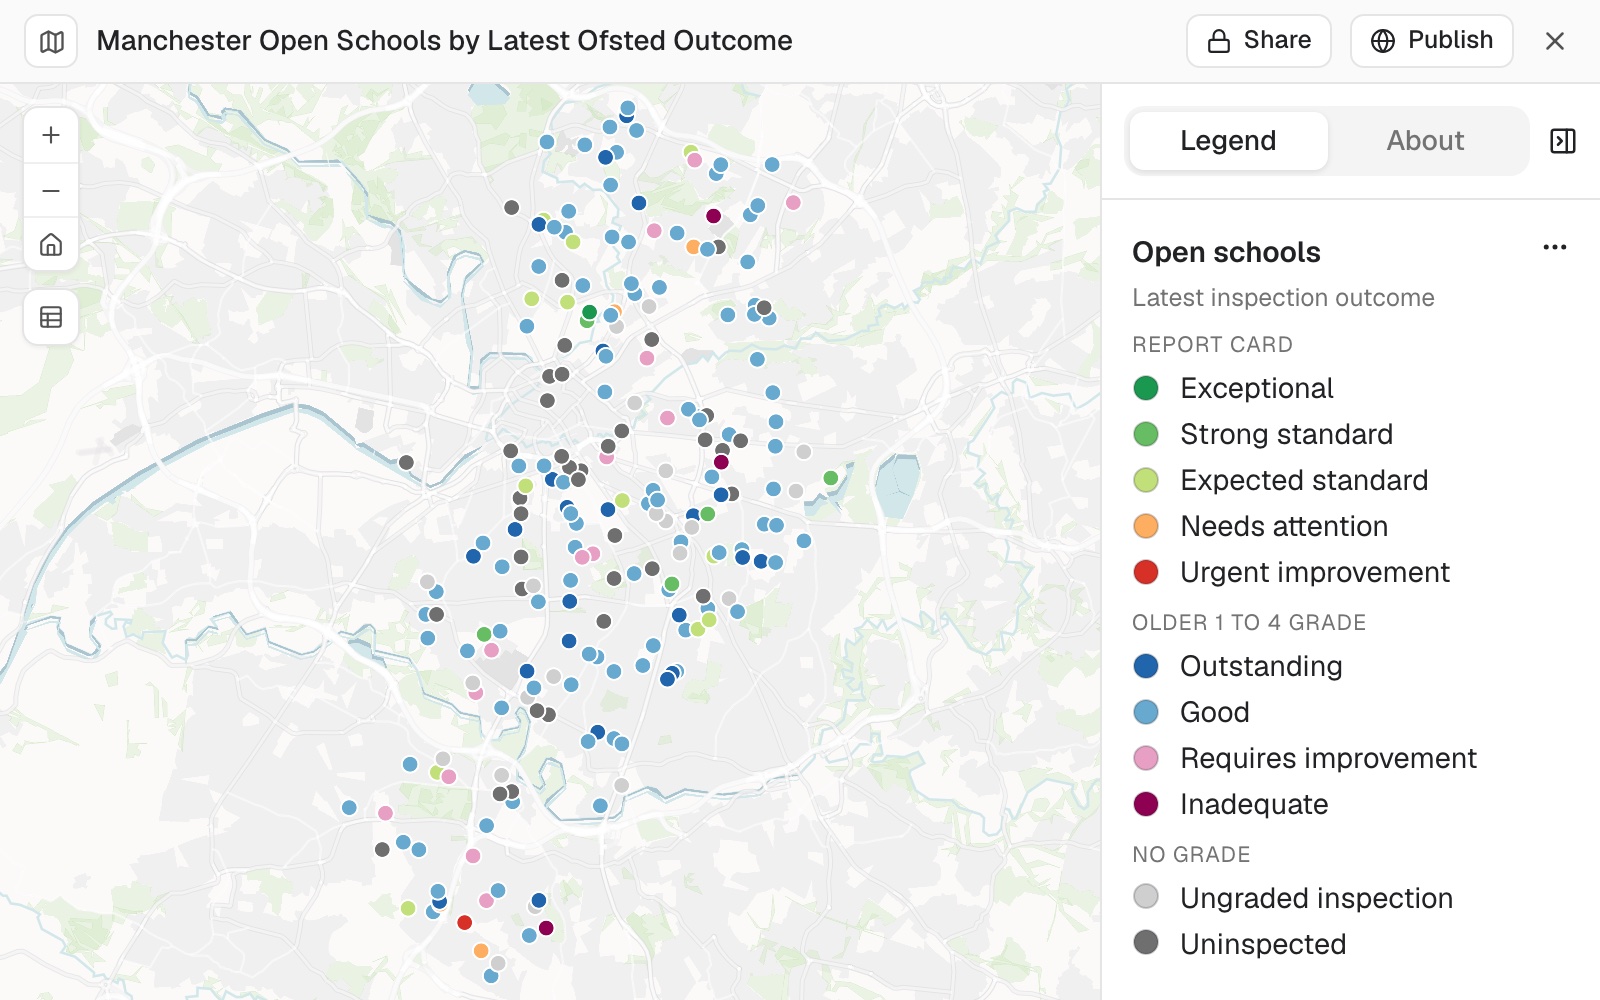 Example: Manchester's 222 open schools coloured by their latest Ofsted outcome from the joined tables, best to worst: the report-card grades, then the older 1 to 4 grades, then no grade.
Make it your own
Show only the 38 uninspected schools and list them by type of establishment.
Size the schools by their number of pupils from the register, and keep the outcome colours.
Common questions
Why did so many rows not match?
Usually because of what each table covers. An export of the latest results for state-funded schools never holds independent or closed schools, so those rows on the register have no partner. Ask: "Which rows didn't match, and why might that be?" In the example 287 register schools had no Ofsted row, and Mapstack named the kinds of school behind them.
What if few or none of the rows match?
The IDs are probably written differently on each side: leading zeros dropped by a spreadsheet, spaces, or a number on one side and text on the other. Ask: "Show me a few IDs from each table side by side."
Will rows without a match be dropped?
Not from the table you say keeps its rows. "Keep every school on the register" makes a left join: register rows with no match stay, with the other table's columns empty. Rows with neither coordinates nor an address cannot be placed on the map; ask how many were left off and why.
How do I check a count?
Ask which column it was taken from, then name the one you mean: "Count only schools whose EstablishmentStatus is Open." A word like "open" can be read from more than one column. Then look up one or two rows you know by name.