

Put aerial, satellite or elevation imagery on a map
Attach a drone survey, satellite image, elevation model or land-cover grid, and Mapstack brings it in as imagery that shows the way that kind of data should.
Imagery is a picture of the ground made of cells, each holding a value: a colour, a height, a temperature, a land-cover class. GIS people call it a raster. Mapstack reads what your file holds and sorts it into one of five types (photo, multi-band image, elevation, measurements or categories), and each type gets the display that suits it: true colour for a photo, shaded relief for heights, class colours for land cover.
Imagery is for seeing: this week's drone flight (an orthophoto or orthomosaic) under the site plan, a valley in relief for a class, a land-cover grid under survey points, a satellite scene in false colour to show vegetation. It sits under your other data as context; analysis works on datasets, not on the cells of an image.
Imagery in plain words: a Sentinel-2 image of fields in Kansas switched to the vegetation display, where the dark green circles are the crops doing best.
- Who can use it
- Creator and Creator Max. Not on Free. A Viewer can open imagery.
- You provide
- Image files that carry their location
- You get
- Imagery that opens on a map, with display options for its type
Put imagery on a map
The example here is real: an elevation model of the central Lake District, from Windermere up to Helvellyn, about 23 by 23 km in 1,024 by 1,024 cells of about 22 m each. The ask below fits that file; the others on this page are examples of the kind of thing to say.
Each image file must carry its location. If the location is in a separate .prj or world file of the same name, pick both together.
It converts each file once, in the background, keeping every value. The card in the conversation updates when it is ready, and you can cancel from the card. The imagery is named after the place it covers when nothing else names it.
The imagery gets a place in your Library. It opens on two tabs: Map, and Details (its type, location, what it covers, the size of each cell, the original files and coordinate system, and statistics such as the lowest and highest values). On a map it is a layer in the legend. Resting the pointer on it shows the value there, and elevation stands up in 3D.
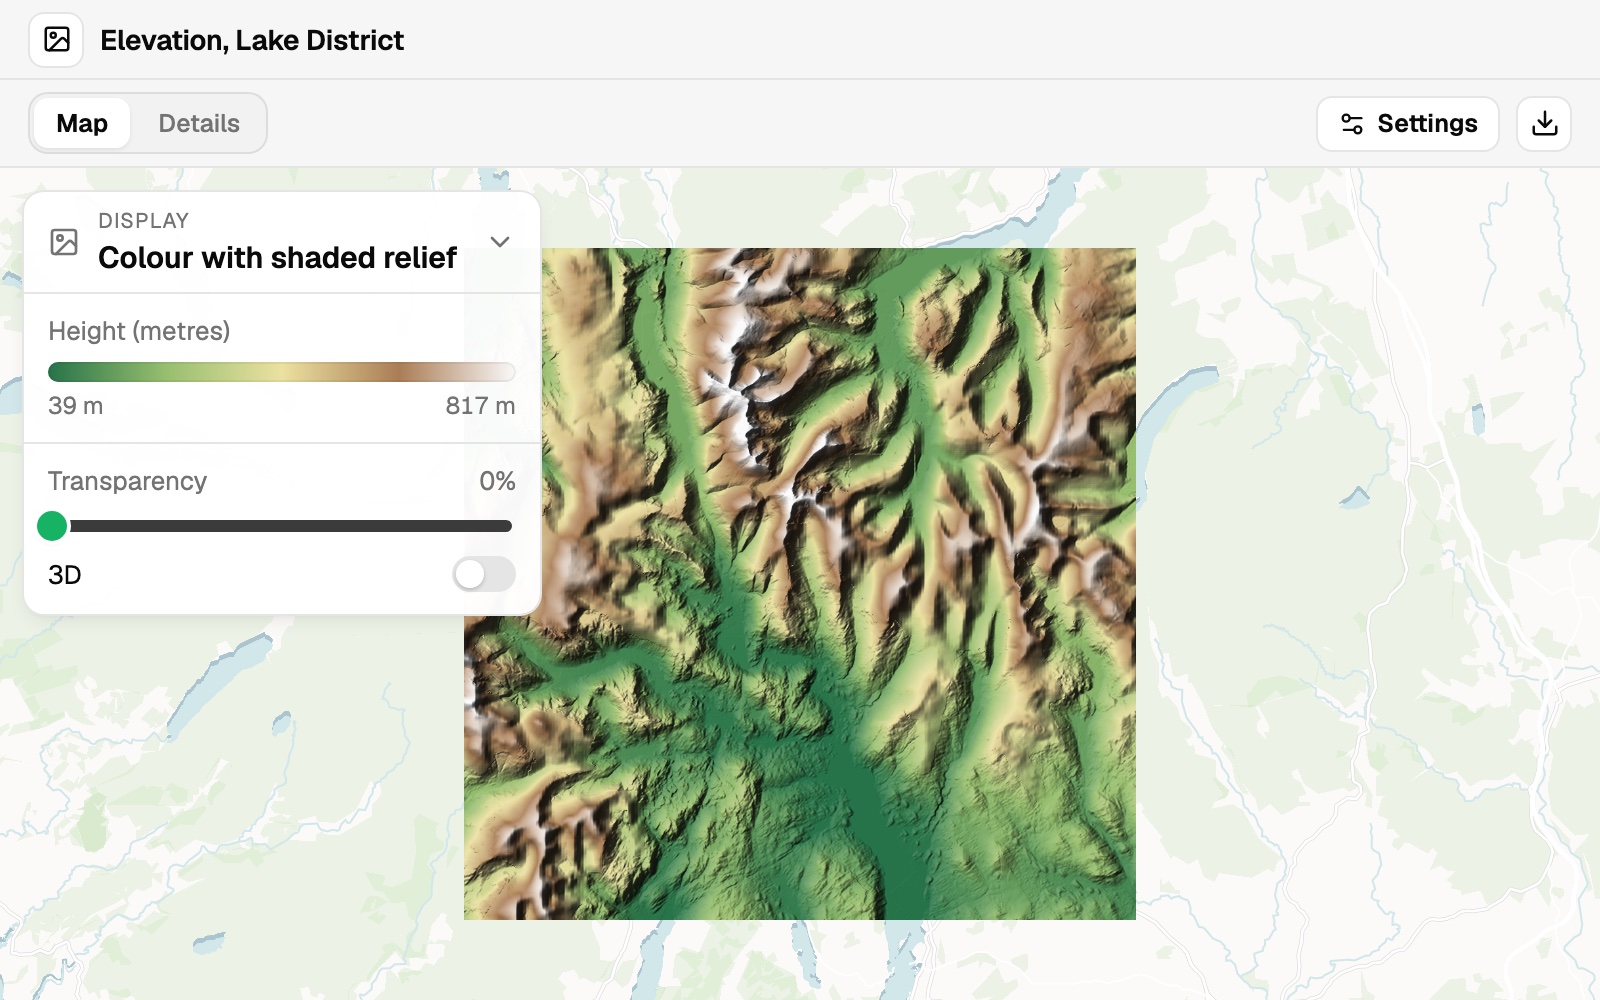 Example: the Lake District elevation model as colour with shaded relief. The colours stretch from 39 m to 817 m, the range nearly all the ground lies in; Details gives the lowest and highest heights, 38 m and 949 m.
Imagery is for display; analysis works on datasets. Asked for the mean, lowest and highest elevation in each of a set of areas (zonal statistics), Mapstack says so plainly and offers what it does with imagery: read heights by resting the pointer on the map, show it in 3D, or map zonal statistics worked out elsewhere and brought in as a table.
Put imagery on a map with your other data
Attach the file and say what you want to see. Name anything from your Library that should go on top.
This is an elevation model of the central Lake District. Show it as shaded relief with an elevation colour ramp, and tell me the lowest and highest heights and their units.
Five types, and how each one shows
It works out the type from the file. Three bands of 8-bit colour is a photo; any other file with several bands is a multi-band image. A file with one band is elevation, measurements or categories, and when nothing settles which, Mapstack asks you.
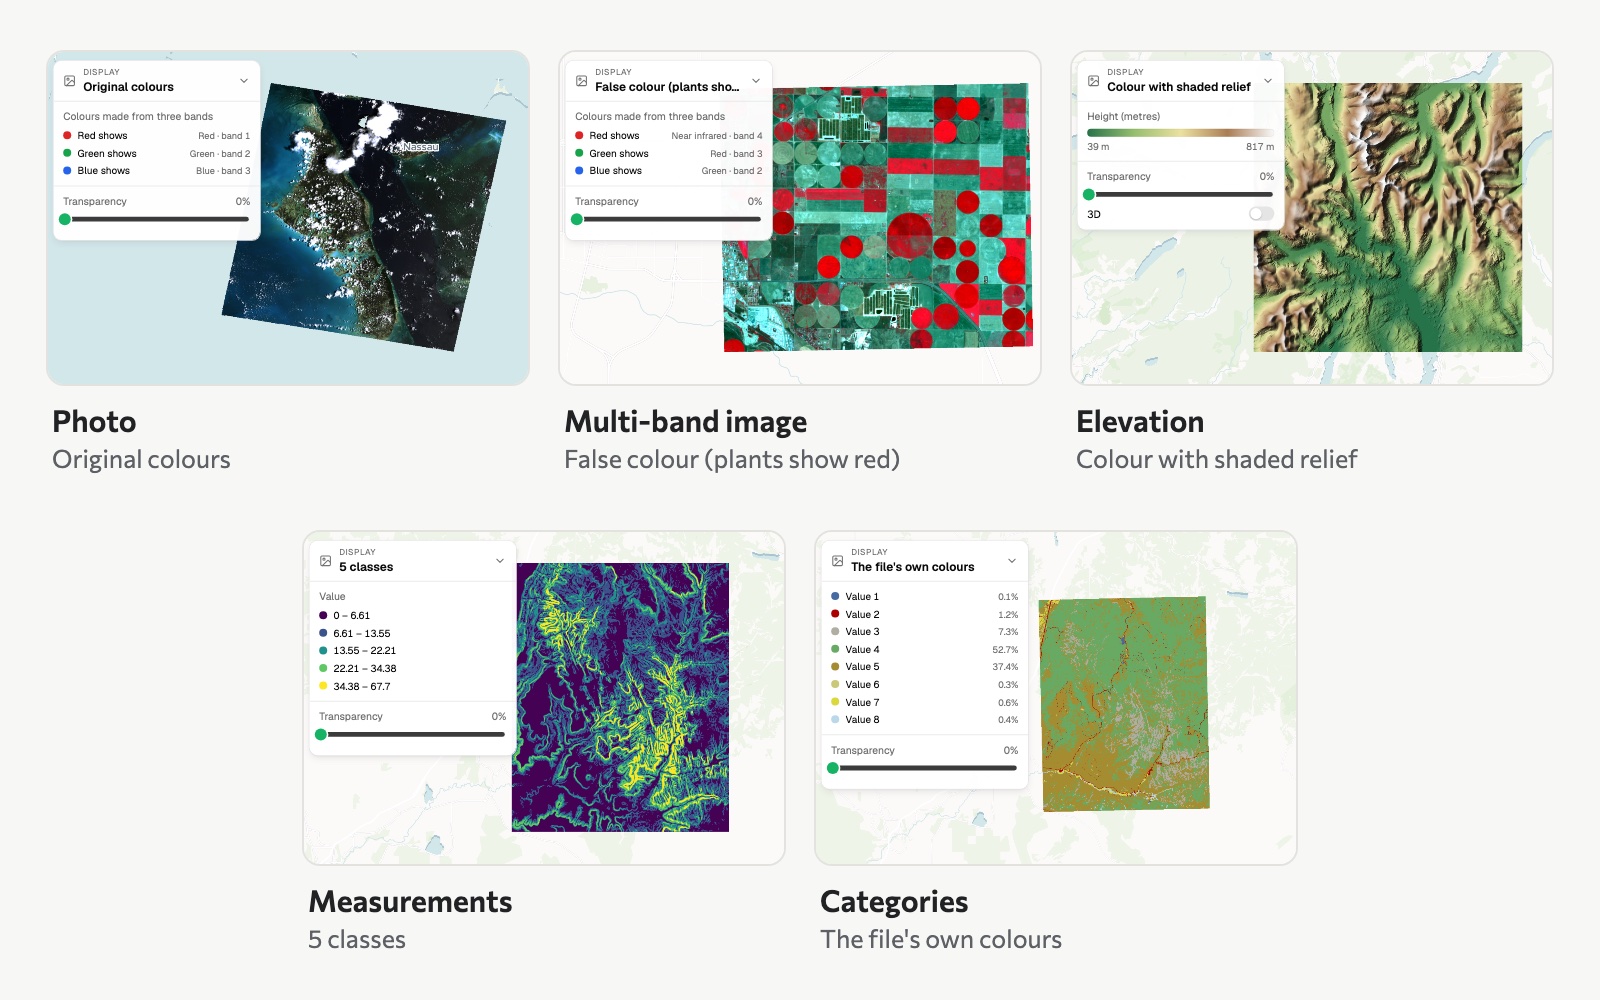 The five types, each in one of its displays: a satellite photo of Nassau in its original colours, a Sentinel-2 image of fields in Kansas in false colour, the Lake District elevation model in colour with shaded relief, slope across Zion in 5 classes, and Zion's land cover in the file's own colours.
Change how it looks. Open the imagery, open Display and choose an option. There is a Transparency slider and a 3D switch. A Display choice is for your view only and is not saved with the imagery.
| Type | Display options |
|---|---|
| Photo | Original colours, Enhanced contrast; False colour (plants show red) for a colour-infrared photo |
| Multi-band image | Natural colour when the red, green and blue bands are known, otherwise Bands 1, 2, 3 as colour; False colour (plants show red); any one band |
| Elevation | Colour with shaded relief, Shaded relief only, Colour only |
| Measurements | Colour ramp, Greyscale, 5 classes |
| Categories | Saved colours, The file's own colours, Our colours |
Two indices appear when the bands they need are known: Vegetation (NDVI, from near infrared and red) and Water (NDWI, from green and near infrared).
Say what the file holds
It says what the file does not. Units, band meanings and class names are often missing from the file itself: which satellite or camera, what each band measures, whether one-band values are heights (and in metres or feet), a measurement's name and units, what each class is called. In the example, the heights are in metres, and the imagery's Details says so. When a file does not state something, Mapstack says so; when it does not know, it does not guess; you can tell it in the conversation or in Settings.
To say it in Settings:
- Open the imagery and select Settings.
- Answer the questions for its type: what kind of photo it is, which satellite or camera took it or what each band measures, whether the numbers are Heights (and in Metres or Feet) or Something else, or a name and colour for each class.
- Select Check it on the map to try the views your answers open up.
- Select Save.
Satellites and cameras you can name, offered only when the number of bands matches your file: Landsat 8 or 9, Landsat 4, 5 or 7, Sentinel-2 (all 12 bands, or the four 10 m bands), NAIP, PlanetScope and PlanetScope SuperDove, WorldView, GeoEye-1 and QuickBird, WorldView-2 or -3, Pléiades and SPOT 6/7, RapidEye, MODIS. Or set the bands one by one.
Tell it what the file cannot say
A file carries its numbers, not always what they mean. Say which satellite or camera took it, what the units are, or what each class is, at any time.
This image is from Sentinel-2, all 12 bands
In the land cover grid, value 3 is forest and value 5 is water
Tiles
Tiles become one image when they belong together: the same coordinate system, number type, number of bands and cell size, touching, and not mostly covering the same ground.
Join tiles into one image
Attach the tiles together. Neighbouring tiles that match are joined; if Mapstack cannot tell whether you want them joined, it asks.
Here are the elevation tiles for the valley. They are pieces of one image.
Reference
Formats
| Format | Extensions |
|---|---|
| GeoTIFF | .tif, .tiff, .geotiff |
| JPEG 2000 | .jp2 |
| ERDAS Imagine | .img |
| ASCII grid | .asc |
| DEM | .dem |
| Location sidecars, same name as the image | .prj, .tfw, .tifw, .tiffw, .j2w, .wld |
How values are kept
| Classes in a category grid | Up to 256 different values |
| 64-bit decimal values | Kept as 32-bit, about seven significant figures |
Very large files: see Sizes and limits.
What it can't do
- Analyse imagery: no zonal statistics, raster calculations or reprocessing. It is for display.
- Take NetCDF, HDF or GRIB time series, raw satellite scene bundles, ECW or MrSID files, or ordinary pictures (PNG, JPEG, GIF).
- Take an image with no location.
- Stack bands or dates of the same place into one image. Files covering the same ground stay separate.
- Bring imagery from Google Drive, OneDrive or Dropbox. Attach it from your computer.
- Take imagery on a Free seat, or from a Viewer.
Common questions
My image doesn't carry its location. What do I do?
Pick its .prj or world file of the same name together with it, or export a copy that carries its location, such as a GeoTIFF. An image cannot be placed without one.
Can I bring a very large image in tiles?
Yes. Cut it into tiles and attach them together: neighbouring tiles that match are joined into one image. How large each file can be is in Sizes and limits.
Can I correct what Mapstack decided about my image?
Yes. If it read the type or the units differently from what you know, say so in the conversation, or open Settings and change the answers.
Can I get the lowest and highest heights?
Yes: they are in the imagery's Details, in the example 38 m and 949 m. Resting the pointer on the map shows the height at that spot.
Can I download the image again?
Yes. Download gives you the original file.