

Put LiDAR, point clouds and 3D models on a map
Attach a LiDAR scan, point cloud or building model and Mapstack places it where it really is, as a scene you can view in 3D beside your other data.
A scene is one survey or one model in 3D: a point cloud (from LiDAR or photogrammetry), a mesh, a 3D object or a building model. Mapstack places it from the coordinate system it was captured in, converts it once in the background, and puts it on an ordinary map, so the scan sits among roads, boundaries and imagery: a survey shown to a client in its surroundings, a corridor scan beside the assets along it, an architect's building model on the site map for a planning meeting.
There is no separate 3D viewer to learn. A scene is a layer on a map like any other.
A scene asked for in plain words: the Autzen Stadium lidar streams onto the map, coarse to fine, then its details show 693,895 points at 6.6 per m².
- Who can use it
- Creator and Creator Max. Not on Free. A Viewer can open a scene.
- You provide
- Point clouds or 3D models that carry their location
- You get
- A scene that opens in 3D, on its own or on a map
Scans on a map
The example here is real: an airborne LiDAR survey of Autzen Stadium in Eugene, Oregon (693,895 points, a public sample file from the PDAL project), with a colour recorded for every point. The ask below fits that file; the others on this page are examples of the kind of thing to say.
It converts each file once, in the background, with progress on its card and a Cancel. In the example, the map was asked for before the conversion had finished: Mapstack waited, then made it.
It reads what the file holds, and tells you: the kind of scene, where it is, its coordinate system and where that came from, how it was captured when the file says (airborne LiDAR, drone LiDAR, mobile or terrestrial laser scan, photogrammetry and others), and which facts the file left unsaid.
The scene gets a card in the conversation and a place in your Library. It opens on two tabs: Map, and Details (the kind of survey, location, number of points, area covered, points per square metre, classes and heights). Its Library card carries a line of facts: in the example, "Point cloud · 302 × 349 m · 693,895 points".
A survey that recorded colour opens in Photo colour, the colours the survey recorded, standing in 3D among the streets around it.
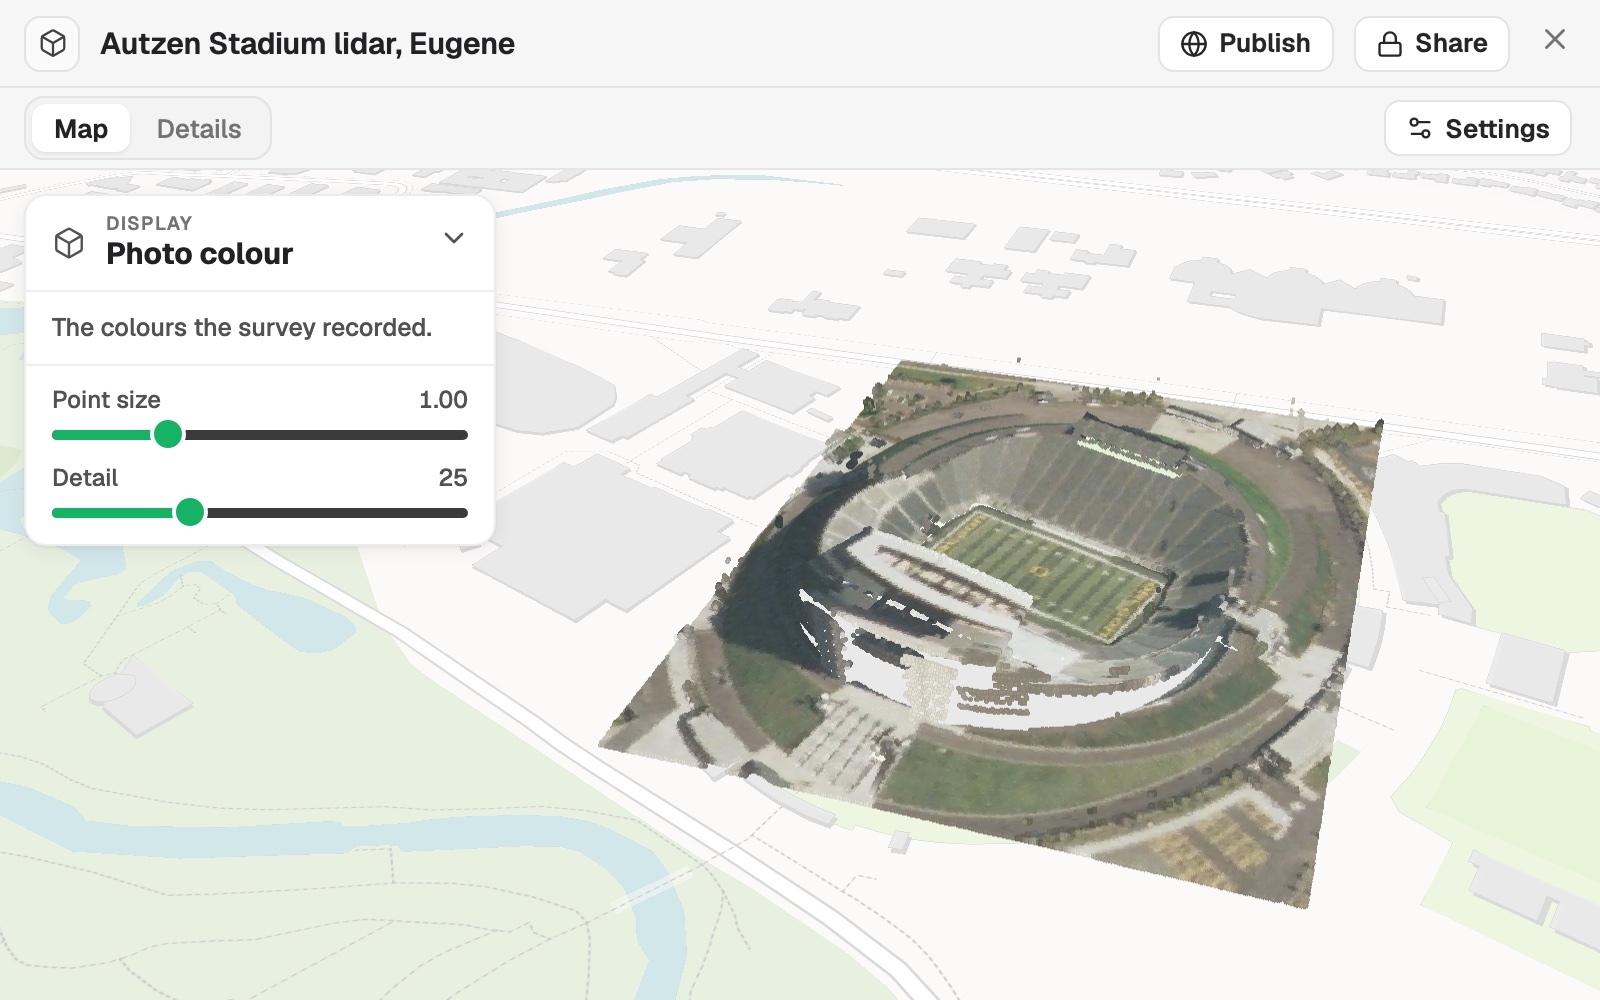 Example: the Autzen Stadium survey in 3D, in the colours the survey recorded, with Display set to Photo colour.
On a map, a scene is a layer in the legend, in the same colours unless you ask for others. Coloured by class, a LiDAR layer's legend lists the classes with their share of the points, each with a box to hide it: in the example, Unassigned 72% and Ground 28%. A map with a scene is drawn flat, never as a globe.
A scene is for showing and describing. Mapstack brings it in, places it, shows it and tells you what it holds; it does not measure or analyse what is in it.
Put a scan on a map
Attach the file and say what you want to see. Mapstack waits for the scene to be ready before it makes the map.
On a map in the colours the survey recorded, then by height; point count, classes, CRS
Where it sits: the coordinate system
It never guesses where a scene is. The coordinate system comes from the file, then from the file's name, then from what you say. If none of those gives it, the file is refused rather than put in the wrong place. In the example, Mapstack read NAD83 / UTM zone 10N from the file itself. A system you name is not used if the file's coordinates do not fall where that system applies.
An IFC building model needs a site location (a latitude and longitude) in the file.
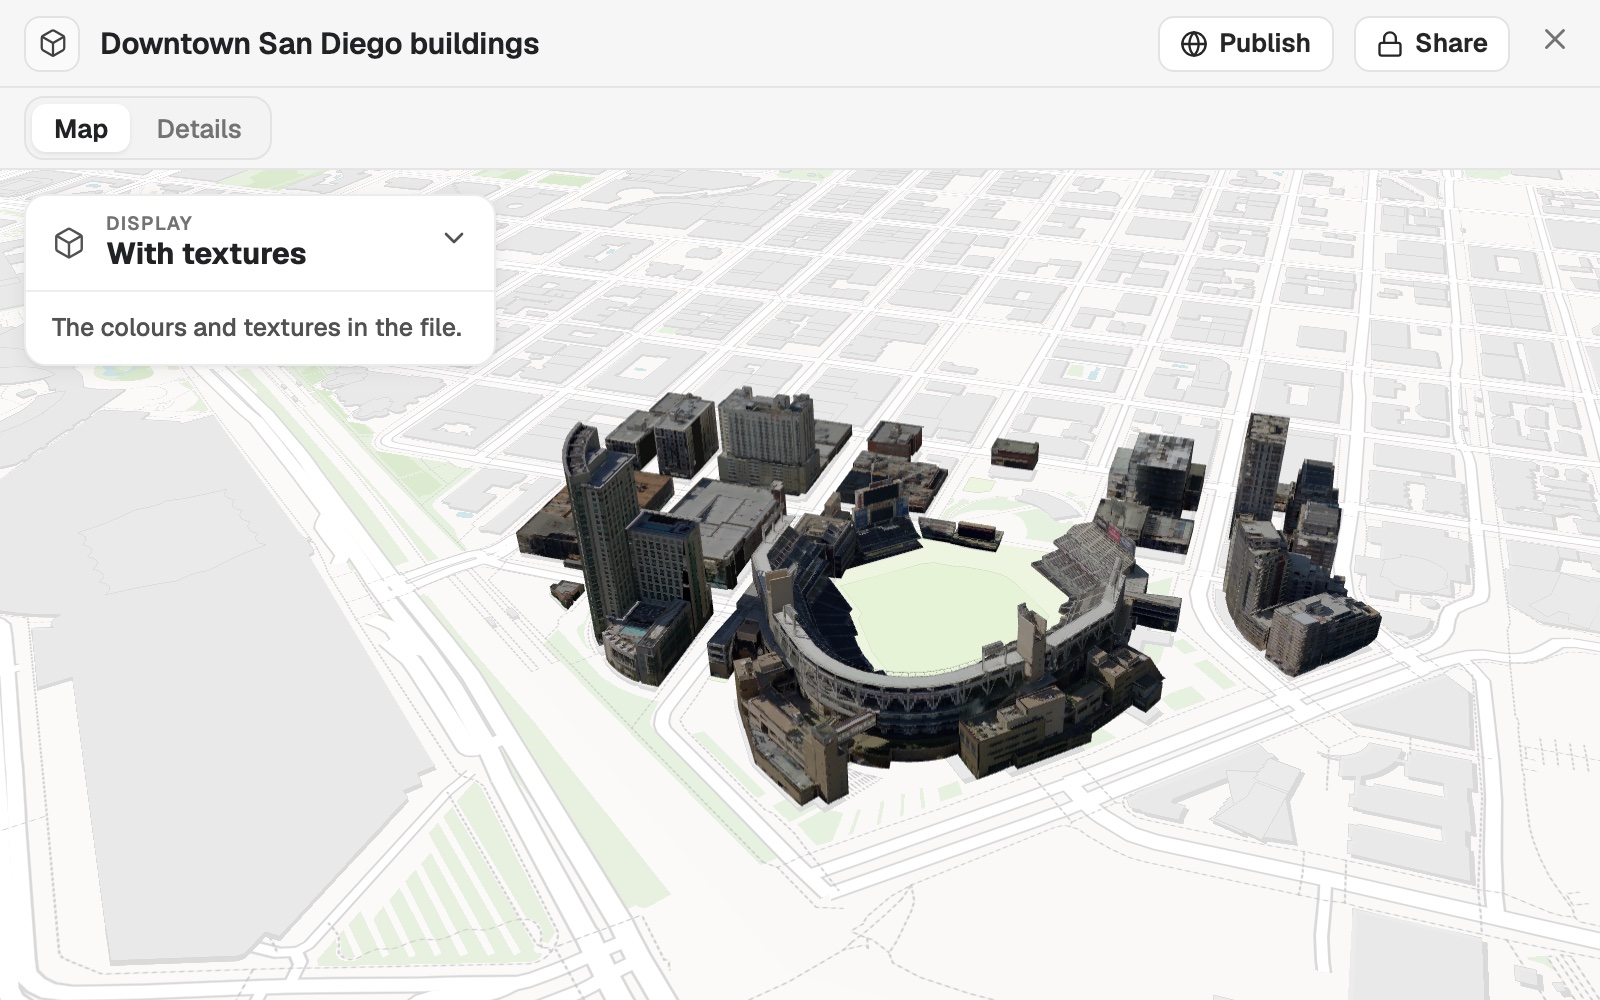 Example: a textured 3D Tiles model of downtown San Diego, placed from the coordinates in its file on the blocks round Petco Park, in the colours and textures the file carries.
Name the coordinate system when the file does not
A scan in its own coordinates cannot be placed until you say which system it is in. An EPSG code is the surest way.
Add our drone survey point cloud. It is in Swiss LV95, EPSG:2056.
Tiles and overlapping scans
It asks before joining scans that overlap. Neighbouring point-cloud tiles become one scene. When point clouds cover the same place, Mapstack asks whether they are One scene: they belong together, Separate scenes, one per file, or None of these: leave them out. A model is always one scene per file.
Bring several tiles in as one survey
Attach the tiles together, or as a zip of LAS or LAZ files. Neighbouring tiles in one coordinate system become one scene.
Here are the lidar tiles for the estate. Add them as one scene.
Colour, classes and heights
Change how a point cloud looks. Open the scene and open Display: colour it by photo colour, class, height or return strength, and set Point size and Detail. Classes can be hidden one by one, and Show all brings them back.
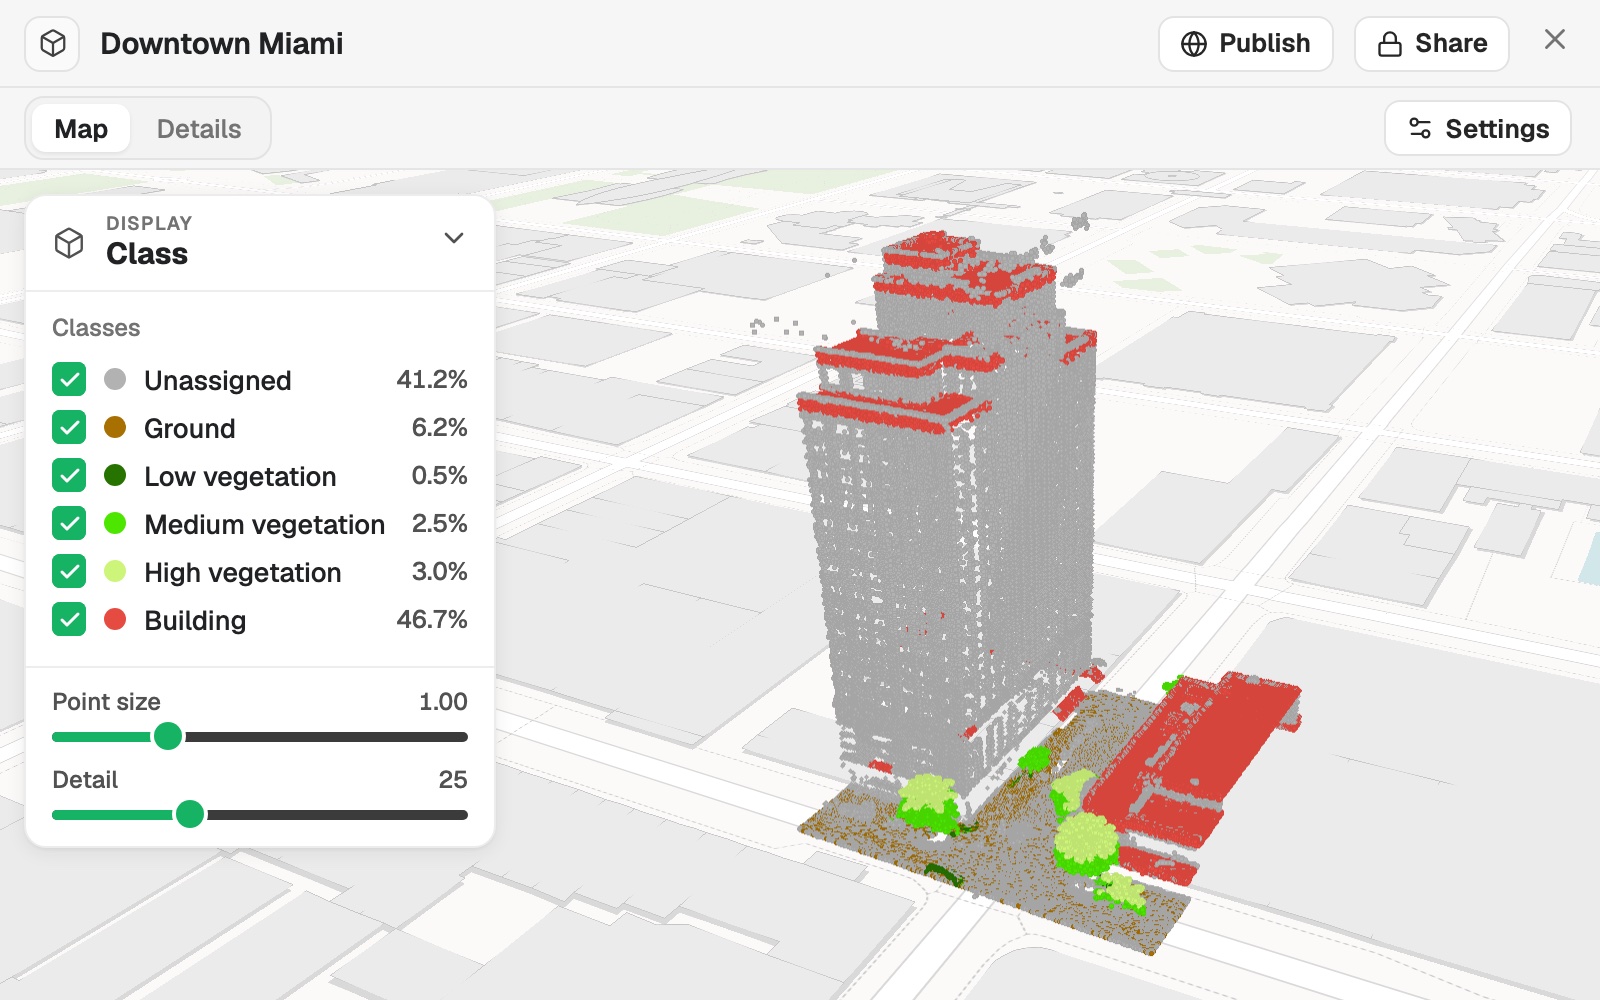 Example: an airborne LiDAR survey of downtown Miami with Display set to Class: six classes, Building 46.7% and Unassigned 41.2% of the points, each with a box to hide it.
Some things a point cloud cannot say, so you say them: whether heights are in metres, US survey feet or feet; whether its colour is real; what each class code means. Standard class codes are filled in for you. Say it in the conversation, or in Settings:
- Open the scene and select Settings.
- Answer How are heights measured?, Is the colour real? and What does each class mean? Codes outside the standard are marked for you to name.
- Select Check it on the map to see your answers on the scene.
- Select Save.
Reference
Formats
| Format | Extensions |
|---|---|
| LAS | .las |
| LAZ, including COPC | .laz |
| E57 | .e57 |
| Esri scene layer package of meshes or point clouds | .slpk |
| 3D Tiles archive | .3tz |
| IFC building model with a site location | .ifc |
| A zip of LAS or LAZ tiles | .zip |
Very large files and point clouds: see Sizes and limits.
What it can't do
- Take 3D files that carry no location: glTF, GLB, OBJ, FBX, PLY, XYZ or PTS. Export the model as one of the formats above, with its location.
- Take an IFC model with no site location, or Esri building (BIM) and 3D object packages.
- Guess where a scan is, or its coordinate system.
- Measure, analyse or answer questions about what is in a scene.
- Join models into one scene. Only point clouds are joined.
- Take scenes on a Free seat, or from a Viewer.
Common questions
My scan doesn't say its coordinate system. What do I say?
Say which system it is in, as an EPSG code, for example 'It is in Swiss LV95, EPSG:2056.' Mapstack checks that the file's coordinates fall where that system is used, so a mistyped code is caught rather than putting the scan in the wrong place.
How do I set the height units?
Open Settings and answer How are heights measured?, or say it in the conversation: metres, US survey feet or feet. A scene that looks too tall or too flat usually needs this.
Can I bring a large survey in tiles?
Yes. Attach the tiles together, or as a zip of LAS or LAZ files: neighbouring tiles in one coordinate system become one scene. How large each file can be is in Sizes and limits.
Where do I find the point count and the classes?
In the scene's Details. On a map, the legend lists the classes with their share of the points.
Can I put a scene on the same map as my other data?
Yes. Ask for a map with both: see Make a map.