

Make a map for paper, a slide or a post
Mapstack designs a finished, static map for where it will be seen, from an A3 sheet at a stated scale to a slide or a social post, as PDF or PNG.
A print is a map made to be looked at rather than explored: one finished page with its title, key and credits, designed for where it will be seen. You download it as a PDF or a picture and put it in a document, a deck, a post or a submission, or print it.
It is how you get a picture of a map. Mapstack designs the page for its purpose, the way a cartographer lays out a figure, decides what goes on it, and changes it when you ask. Name anything that must be on it, when you ask or afterwards; anything you do not mention is kept.
A print asked for in plain words: a square social post of Pretzel Hatch's 149 sites, built from the outline to the small print.
- Who can use it
- Creator and Creator Max. A Viewer can open and download a print.
- You provide
- A map or datasets, and where the print will be seen
- You get
- One designed page, as PDF or PNG
A GIS sheet or a data visualisation
There are two kinds of print, and Mapstack chooses by what it is for:
- A GIS sheet is a conventional map sheet for paper: the map, a title panel, a scale bar and a statement of scale, a north arrow if you want one, a key and credits. It is for figures to a standard: a committee pack, a planning submission, a site plan, a reference sheet.
- A data visualisation leads with a title that states the finding, with the map, its key, short notes and a source line, and can carry callouts and a chart. It is for slides, social posts (LinkedIn, Instagram and the like), articles, annual reports and board packs.
Tell Mapstack:
- The data: a map to start from, or datasets. A GIS sheet can also take imagery from your Library.
- Where it will be seen, and what it is for.
- Anything it must carry, and exact words where they matter.
- The paper size, scale or format, if you have one in mind.
On one job, Mapstack made an A3 landscape GIS sheet of active bus stops in each of Liverpool's 64 wards for a committee pack, with a title block, figure number, revision and date, a scale of 1:70,000 at A3, a north arrow, a key and credits. That job is written up in Make a figure to a standard.
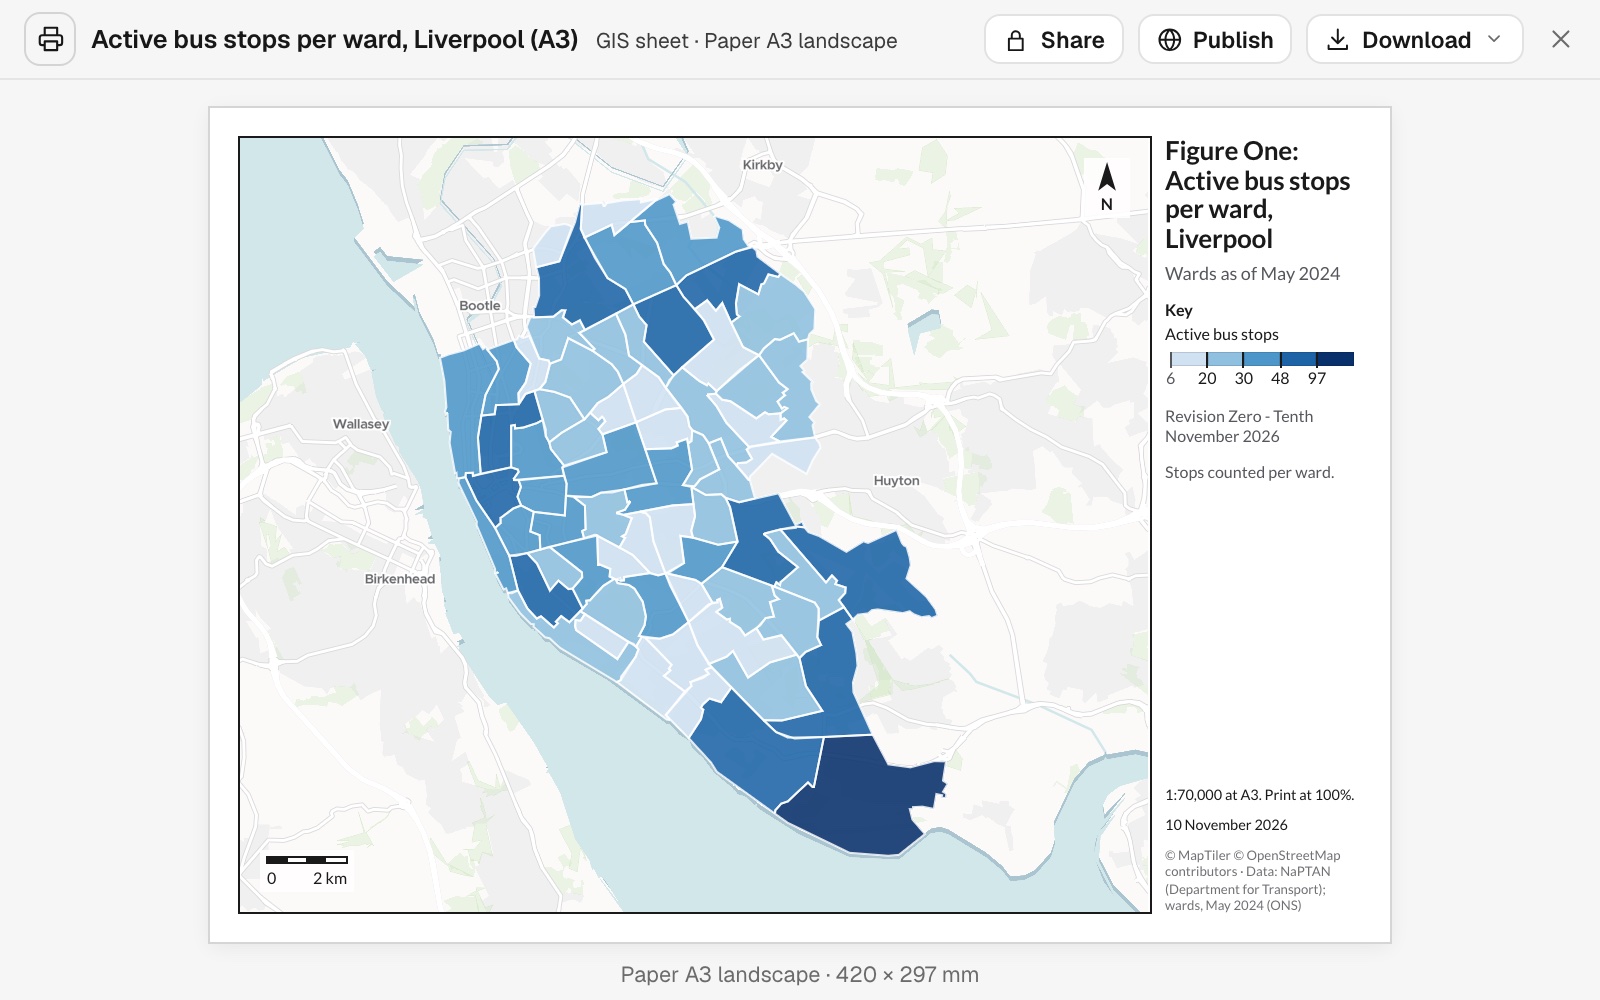 Example: the A3 landscape GIS sheet, with its key, scale statement, north arrow and credits.
You get a card in the conversation labelled with its kind and size (for example "GIS sheet · Paper A3 landscape"), and an entry in your Library. It opens on the page itself, with its details (scale, when it was made, sources, what it was made from) on a second tab. Making a print uses part of your allowance. See Your allowance.
Switching kind drops what the new kind cannot carry. A chart, for example, is dropped when a data visualisation becomes a GIS sheet.
One ask can give you the map and the print. Ask for a web map and a sheet for the wall in the same message. Both come from the same layers and the same figures.
A figure for a report or submission
Name the paper size and orientation, and everything the sheet must carry. What you name is put on the page; what you leave out, Mapstack decides.
Now a print for the committee pack: an A3 landscape GIS sheet of walk access by ward. Title block with figure number 1, revision 0 and today's date, scale bar and scale statement, north arrow, legend, ward labels, and a sources and copyright note.
A picture for a slide, a post or a web page
Say where it will be seen. If it should state a figure ("92.9% of residents..."), ask for the analysis that gives the figure first.
Make a slide of walk access by ward for the committee presentation
Size, scale and layout
It designs the page to its purpose. The map, key and title are laid out for the size you named, and on paper the scale is worked out for the sheet and stated ("1:70,000 at A3. Print at 100%"). A format, orientation or paper size you name is kept.
| Format | Size |
|---|---|
| Paper | A4 (the default), A3, Letter or Tabloid, portrait or landscape, at true size and 300 dpi |
| Slide | 1920 × 1080 px, landscape |
| Social post | 1080 × 1350 px (4:5) or 1080 × 1080 px; landscape 1920 × 1080 px |
| Story | 1080 × 1920 px, portrait |
| Embed (a figure for a web page, article or document) | 16:9, 3:2, 4:3, 1:1 or 4:5, at 80, 160 or 250 mm wide, 300 dpi |
A GIS sheet is always on paper; a data visualisation can be any format.
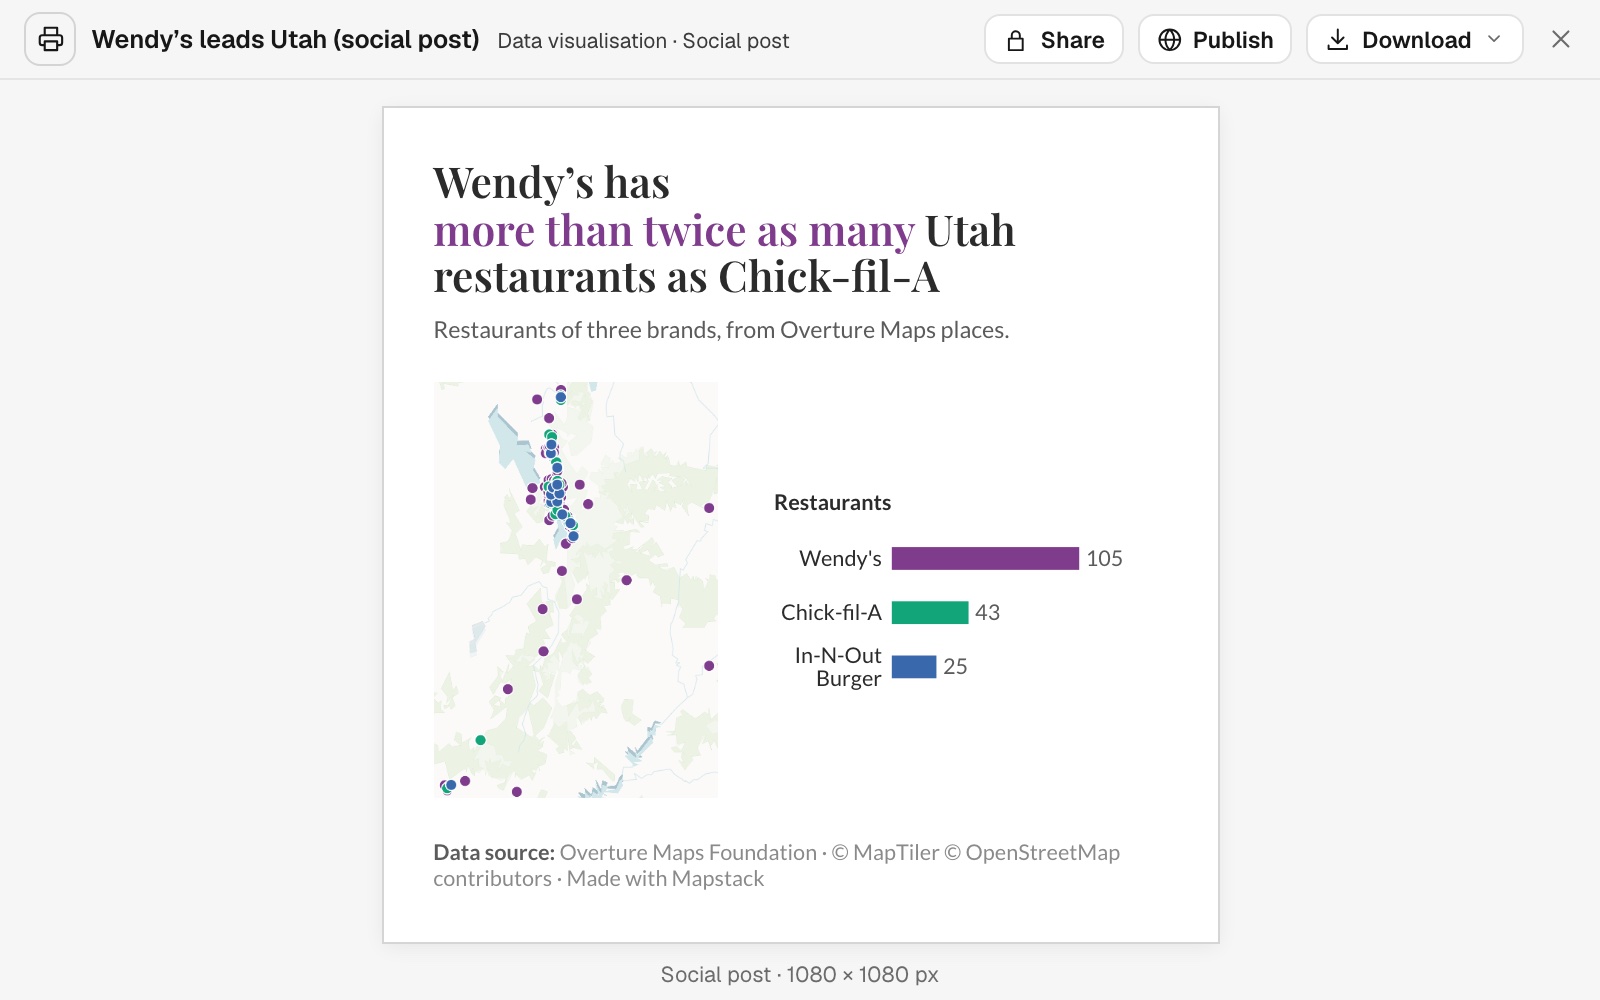 Example: a square social post, 1080 × 1080 px, laid out as one row: Utah's restaurants of three brands on the map, and bars that double as the key, Wendy's 105, Chick-fil-A 43 and In-N-Out Burger 25.
It leaves out what would harm the page, and says so. Asked for labels on all 64 wards of the A3 sheet, Mapstack left them off because they would overlap in the small wards, said so, and pointed to the map and the report, where every name can be read. When there is no room for every label, it says how many it drew. Each place where the page departs from your request is listed.
Every print passes checks before it is saved. Nothing clipped or overlapping, all text large enough to read, the key matching the map, the map not stretched, the scale measured true, the credits shown. A page that fails a check is corrected and drawn again.
Sheet furniture and numbered places
These go on a GIS sheet. Numbered places need one layer of points. A logo needs a logo uploaded to your workspace.
A "You are here" marker. One named place can carry its own large symbol and a boxed label, with its own line in the key.
Add sheet furniture: north arrow, locator, grid, stamp
On a GIS sheet: a north arrow, a locator map, a latitude and longitude grid round the frame, a status stamp such as DRAFT, standard notes such as "Do not scale from this drawing", and a fixed scale.
Add a north arrow and a locator inset to the site plan, and stamp it DRAFT
Number many places and list them
Where names would crowd the map, a GIS sheet can number the places, north-west to south-east, with a table in number order. Say which columns the table shows. A long list goes on a second page.
Number the 48 depots on the sheet and add an index with name, address and bays
Callouts, charts and figures in the words
Figures come from analysis. A print does not work figures out. A GIS sheet's figures trace to the data; a finding in a data visualisation's title needs an analysis that gives it. Without one, the title says plainly what the map shows and where.
Words for amounts mean what they say. Where a word describes a share from an analysis, it is checked against the share: "most" means more than half, "about a third" means 30 to 37%, "nearly all" 90% or more. If the words do not fit the figure, they are changed to fit.
A callout points at one real place. It must match one record in the data, so name the place as the data names it.
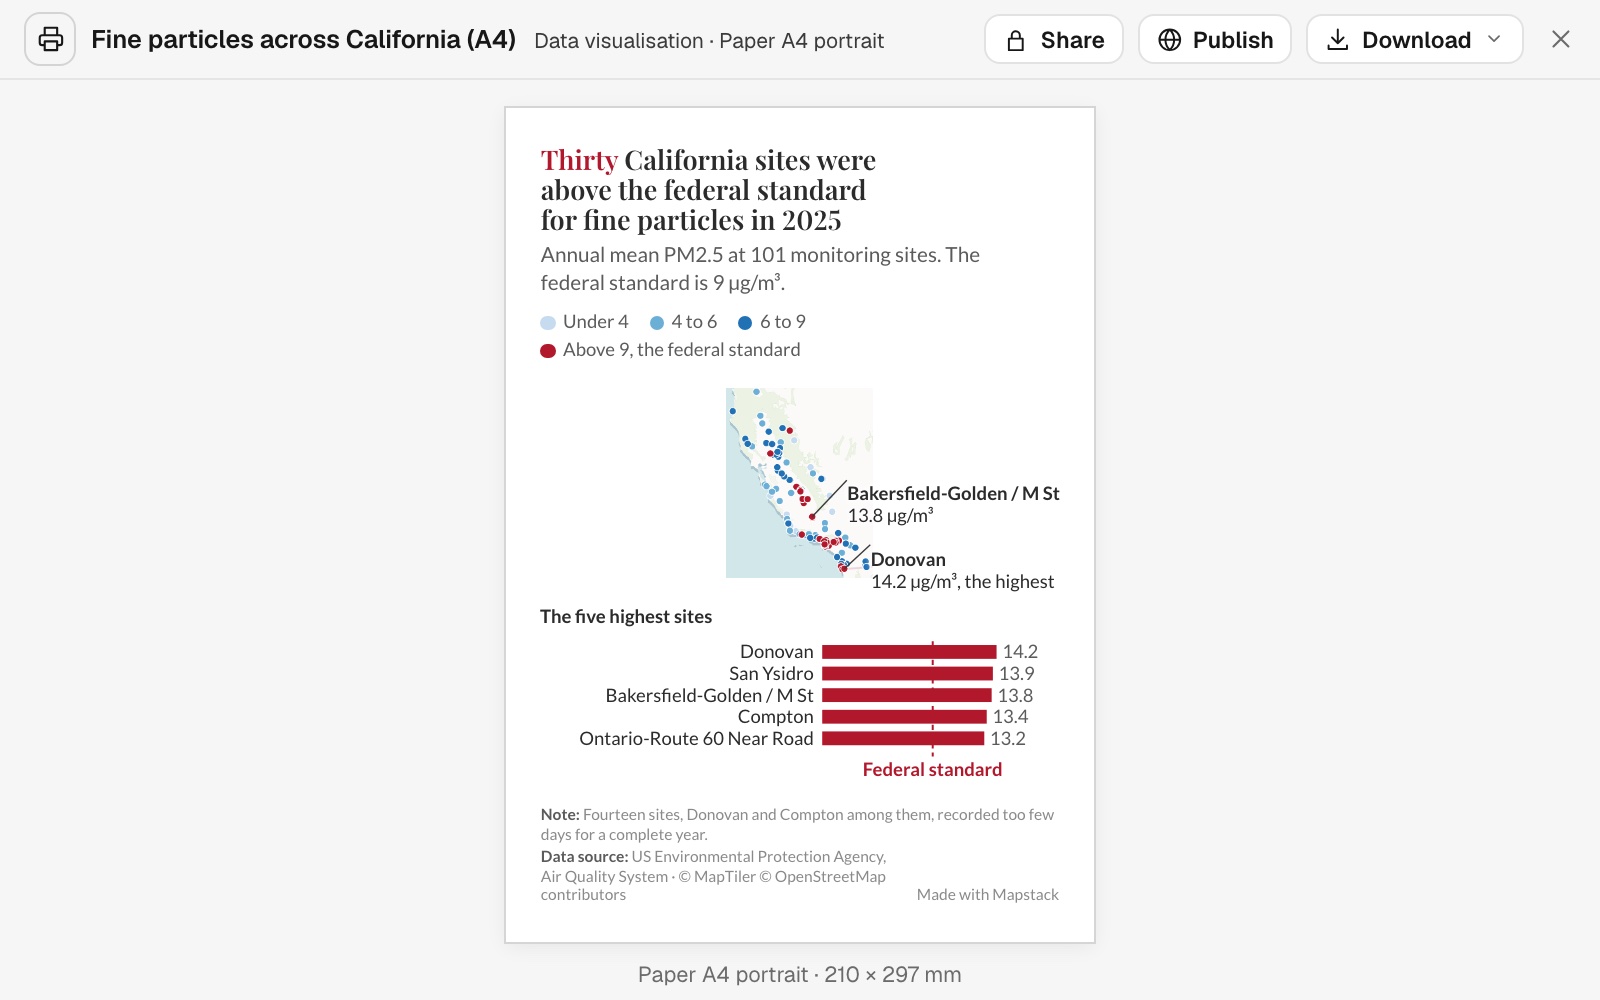 Example: an A4 data visualisation whose title states the finding, thirty of California's 101 monitoring sites above the federal standard for fine particles in 2025, with callouts on Donovan (14.2 µg/m³, the highest) and Bakersfield-Golden / M St (13.8), and bars for the five highest sites.
Point at a place, or add a chart
On a data visualisation: callouts on real places in the data, and one chart beside or under the map.
Add a callout on the most wooded parish
Put bars for the ten wards with the highest rents beside the map
Put a figure in the words
Figures in the title, notes and callouts come from an analysis in the conversation. You can ask for the analysis and the print in one message.
Your words, and the credits
Your words are used, and numbers come from data. Give the exact words for the title block and credits and they are used as given. Numbers on a print come only from your data and its analyses, so a figure number, revision or date you give is written in words: on the A3 sheet, "Revision Zero" rather than "Rev 0".
Credits are written for you. The credits line names the basemap and the data sources, and is always there. Read it against your house style, and give the exact wording where it needs to change.
Changes and revisions
It is a snapshot. A print keeps the copies of the data it was made from until you ask Mapstack to bring it up to date.
Change it, or issue the next revision
Say what should change; everything else stays as it was. To use the latest data, ask for it to be brought up to date.
Reissue the walk access figure as revision 1, with the boundary credit changed to Office for National Statistics
Go back to an earlier version
Every page is a version. Each page that passes its checks is kept with its PNG and PDF, and Version at the top shows which one you are looking at. Select Version, pick the version you want, then Restore: the page comes back as the newest version, and the one you left stays in the list. A print card in the conversation also shows Revert when its version is no longer the current one. How many are kept is in Sizes and limits.
Download, share and publish
Download gives Download PDF (true size, with real text), Download PNG, Copy image and Print, and the list page when there is one. Share and Publish are beside it.
Reference
One map per page, north up, never stretched. Basemaps are from MapTiler.
On both kinds
| Item | What it holds |
|---|---|
| Title | On a GIS sheet it names the subject and place; on a data visualisation it states the finding |
| Subtitle | The measure, the place and the period |
| Key | Whenever the map shows data. At most 5 entries on a social post or story |
| Credits | Always. Written by Mapstack |
| Notes | Up to 3 |
| Figures in the words | Up to 12, from analysis |
| Labels | A GIS sheet names up to 25 places, or numbers up to 90 with a list; a data visualisation names up to 10 |
On a GIS sheet
| Item | Options |
|---|---|
| Scale bar | Always. Metric, imperial or both |
| Scale statement | Such as "1:1,250 at A3". Any scale from 1:100 to 1:1,000,000 |
| North arrow | |
| Locator inset | City, region (the default) or country |
| Logo | Your workspace's logo, when it has one |
| Latitude and longitude grid | Ticks or lines |
| Status stamp | Draft, for information, for comment, preliminary, issued, for planning |
| Numbered places with a list | 1 to 4 columns in the list. More than 12 rows puts the list on its own page |
| Standard notes | "Do not scale from this drawing." "Print at 100%; do not fit to page." "Not for survey or measurement." "Data may be incomplete." "Boundaries are indicative." |
| Imagery | An aerial photo, satellite image, elevation or measured grid, under or instead of the data |
On a data visualisation
| Item | Options |
|---|---|
| Callouts | Up to 5, on real places |
| One chart | Bar, line, pie or donut, histogram, scatterplot, box plot or calendar chart |
| Plain ground | The map on a plain ground instead of a basemap, with the outline of a named place |
Smallest text: 6 pt on a GIS sheet, 7 pt on other paper and embeds, 22 px on a slide, 26 px on a story or portrait post.
What it can't do
- Hold more than one map, or anything interactive. Readers get no popups, filters or controls.
- Make a series of sheets or a map book. A print is one page, with a second page only for a long numbered list.
- Be edited by hand. A print is changed by asking.
- Put callouts or a chart on a GIS sheet, or a fixed scale, numbered list, standard notes or imagery on a data visualisation.
- Show 3D scenes.
- Add client, project, drawn-by or approval fields to a GIS sheet's title panel.
- Show a national grid. The grid is latitude and longitude.
- Use paper sizes other than A4, A3, Letter and Tabloid, or Ordnance Survey base mapping.
- Show a logo other than your workspace's own.
- Stamp a sheet "issued" or "for planning" unless you say so.
- Be made from a Free or Viewer seat.
Common questions
Can I choose the scale?
Yes. Ask for a scale or a paper size and the page is designed again around it. The PDF is at true size: print it at 100%, not "fit to page", and the stated scale holds.
Why aren't all the places labelled?
Labels that would overlap are left off, and Mapstack says how many it drew. Ask for labels on a few named places, for the layer to be filtered, or say "Number the places and add a list".
Can the title state a figure, such as a percentage?
Yes, once an analysis gives it. You can ask for the analysis and the print in one message. Without one, the title says plainly what the map shows and where.
Why did Mapstack change my words?
A word for an amount has to fit the figure behind it: "most" means more than half, so "most" for 48% is changed to words that fit. Other words you give are used as you give them, and numbers you give are written in words.
Does it update when the data changes?
No. A print keeps the copy of the data it was made from. Ask Mapstack to bring it up to date and it is drawn again from the current data.