

Make a set of figures in one style, and the same figure for the next site
Make numbered figures for one report on a shared layout, keep them consistent as you revise them, and repeat the usual figure for a new site.
Best for
Consultants, planners and environmental teams who issue a numbered set of figures for a report, and the same figure again for every new project. You end up with each figure as its own print on one layout, revised by letter, and the usual figure for the next site on the same layout.
The example in this guide makes figures for an environmental report on Hinkley Point C in Somerset, then the same site location plan for Sizewell C in Suffolk. Nothing was attached: Mapstack found each site's boundary in open data, drew the distance rings and took the population from the Office for National Statistics' Census 2021 by output area. Every ask below was sent, and results vary in the detail from one run to the next. Make a figure to a standard covers a single figure; this guide is about keeping several the same.
What you need
- A Creator or Creator Max seat. Prints are made on paid seats.
- Your figure standard: paper size and orientation, scale, what the title block carries, and how you number figures and revisions.
- The site, by name, by address, or as a boundary file. Without a file, Mapstack can place it from open data.
Before you start
- Make the first figure the template. Name everything it must carry in the first ask. Later asks can then say "same template as Figure 1".
- Each figure is its own print. There is no figure set or map book: one ask makes one page, and binding the PDFs into one document is done outside Mapstack.
- Figure numbers and dates are written in words. The title block reads "Figure Two · Rev B · Eleventh November 2026". Asked for digits, Mapstack said its checks keep numerals on the page for values that come from the data. The scale statement and the date line beneath it stay in figures.
The prompt
We're preparing the figures for an environmental report on Hinkley Point C. Figure 1: an A3 landscape site location plan, the site marked, 5 km and 10 km rings, main roads and settlements labelled, our title block with project name, figure number 1, revision A and today's date, scale bar, north arrow, and sources.
What to expect
Mapstack asks what it cannot know
Before making anything, it asked whether there was a site boundary file to use and what the project title should be. The answer in the example:
No boundary file: place the site from open data and mark it with a point. Project title: Hinkley Point C Environmental Report.
It found the project in the national register of infrastructure projects and the site's boundary in OpenStreetMap, marked the site with a point and drew the rings as buffers (areas within a set distance) of the boundary, not of a single point. It said so, and put a note to that effect on the sheet.
Figure 1 sets the layout
The sheet is designed for the paper: A3 landscape at 1:100,000, with the title panel, key, scale bar, north arrow, credits and the line "Print at 100%". Settlements and main roads come from the base map. This first figure is the one the others are measured against, so check it hardest.
You ask for the next figure on the same template
Figure 2, same template and numbering style: population within 10 km by output area, Census 2021.
Mapstack fetched the census population by output area, kept the areas near the site and made Figure 2 with the same title panel. It said it had matched Figure 1 "as closely as possible", and it was not exact: Figure 2 came out at 1:80,000, with a diamond for the site where Figure 1 had a circle, and the output areas inside the 5 km ring were missing.
You compare the figures and name the differences
Put each new figure beside the first and list what differs. Mapstack fixes what you name:
Figure 2 doesn't match Figure 1 yet: it's at 1:80,000 instead of 1:100,000, the site is a diamond instead of a circle, and the output areas inside the 5 km ring are hidden. Reissue Figure 2 as revision B with the same scale, extent and site symbol as Figure 1, showing every output area within 10 km, including those inside 5 km. In both figures write the number and date as 'Figure 2 · Rev B · 11/11/2026', not in words.
Revision B matched the scale and the symbol, and kept the number and date in words after asking. The inner output areas were still blank, so the next ask asked why:
The output areas inside the 5 km ring, around Stogursey, are still blank on Figure 2. Were they included in the 54? If not, add them, reissue Figure 2 as revision C, and tell me the total population within 10 km.
They had not been included: the "10 km" layer it had used was the ring between 5 and 10 km. Revision C covers the whole area, 59 output areas, and gives 11,399 residents within 10 km, sharing out the figures of areas cut by the ring by the part inside it.
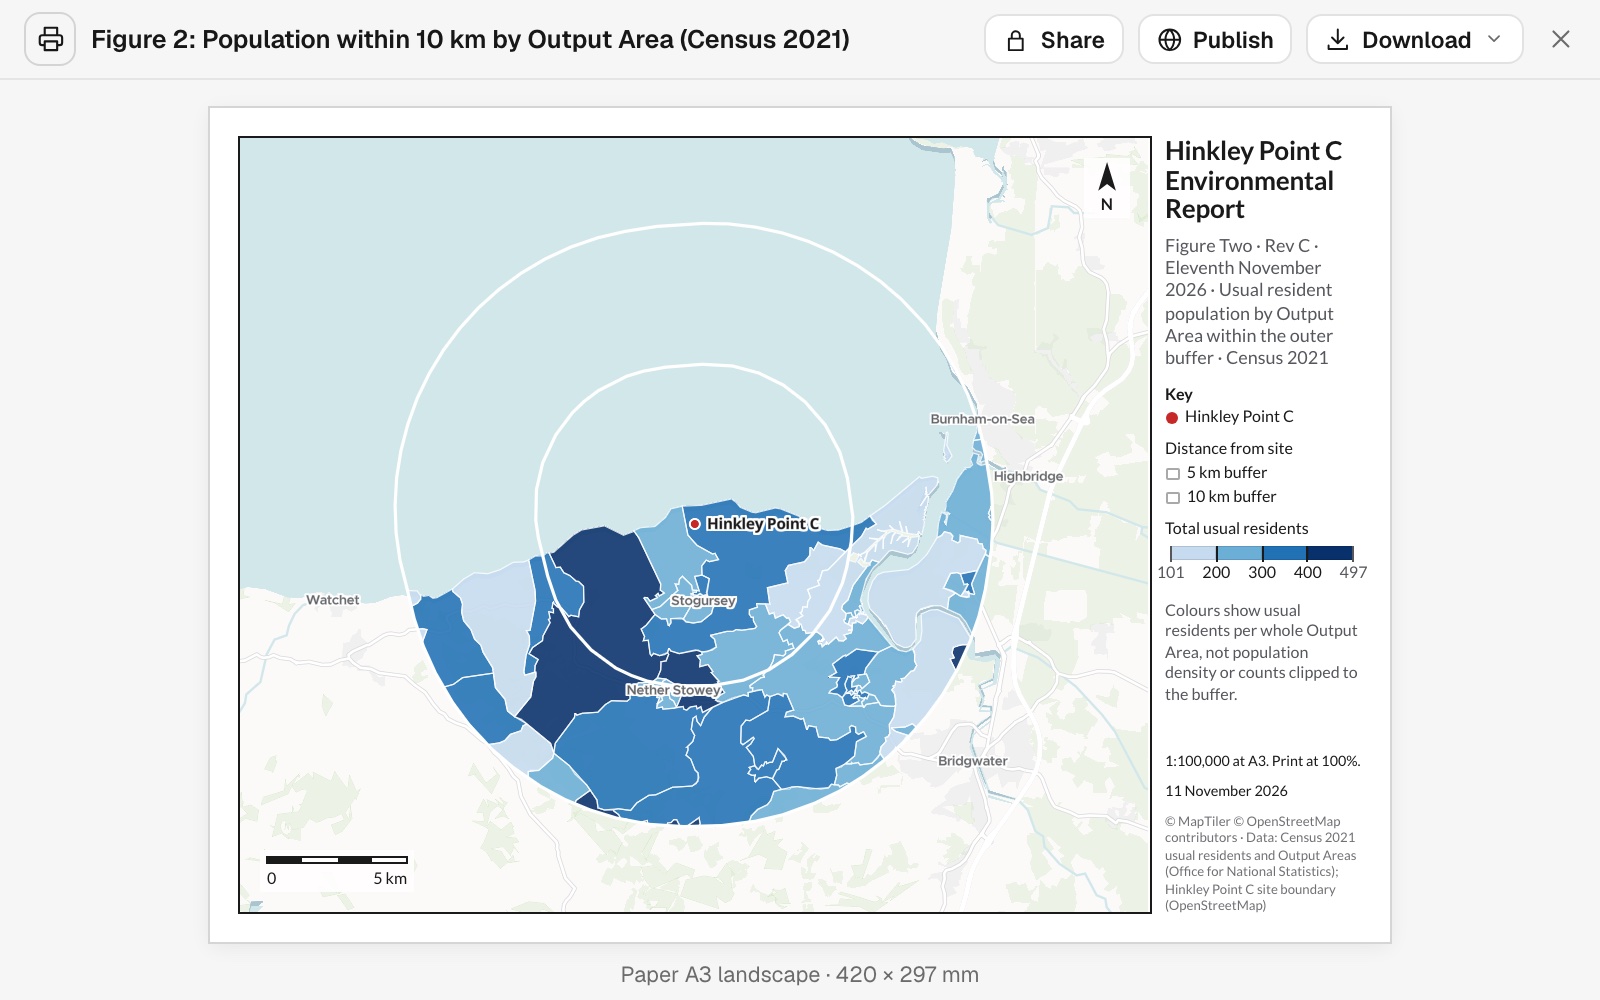 Example: Figure 2, revision C. Census 2021 usual residents in the 59 output areas within 10 km of Hinkley Point C, on the same A3 layout and 1:100,000 scale as Figure 1.
You make the usual figure for the next site
Now our usual site location plan for the new project, Sizewell C in Suffolk: same layout as Figure 1, re-centred, title block updated.
Mapstack found the new site, drew its rings the same way and made the plan on the same layout: A3 landscape, 1:100,000, the same title panel with the new project's name, the same circle for the site. It is a new print, so the Hinkley figures are unchanged.
Make it your own
The white rings disappear over land on both site location plans. Make the 5 km and 10 km rings dark grey dashed lines, labelled 5 km and 10 km, and reissue the Sizewell C plan as revision B.
Common questions
Will later figures match the first one exactly?
Closely, not exactly. Put each new figure beside the first, compare the scale, extent, symbols and key wording, and name every difference in one ask, for example "Reissue Figure 2 as revision B with the same scale, extent and site symbol as Figure 1."
If I change one figure, do the others change too?
No. Each figure is its own print, and an ask changes only the figure it names. Say which figures a change applies to.
Can I get the whole set as one document?
No. There is no figure set or map book: one ask makes one page. Download each figure as a PDF and bind them into one document outside Mapstack.
Can the figure number and date be in digits?
Not in the title block: there they are written in words, such as "Figure Two · Rev B · Eleventh November 2026". The scale statement and the date line beneath it stay in figures. If your standard needs digits, number the figures in your report's own captions.
How do I check a population figure?
Ask where it came from, the way you would ask a colleague: "How many output areas does this count, and how did you share out the areas cut by the ring?" Then look at the figure for any area inside the distance that is not shaded.