

After a storm, fire or flood: find which of your sites were inside it, and who to call first
Put your sites against the published footprint of an event, total what was inside each band, and get a call list in priority order.
Best for
Anyone who has to act in the days after an event: emergency planners, insurers and claims teams, care and housing providers, utilities, anyone with sites or customers spread over a region. You end up with every site marked with the worst band of the event it was in, a total of what was exposed in each band, a call list in the order you set, and a map.
An event footprint is the area an event covered, as an agency publishes it: a hurricane's wind swath, a wildfire perimeter, a flood extent, an evacuation zone. It is a file of shapes, and it usually arrives within hours.
The example in this guide is Hurricane Isaias, which came ashore near Fort Walton Beach, Florida, on 10 October 2026. Two public files are used. The first is the National Hurricane Center's wind swath for the storm: three nested areas that had winds of at least 34, 50 and 64 knots. The second is the list of every certified nursing home in Florida, Alabama, Georgia and Mississippi from the Centers for Medicare & Medicaid Services: 1,476 homes, each with its address, phone number, beds, average residents and coordinates.
What you need
- The footprint, as a GIS file from the agency that publishes it.
- Your sites, as a spreadsheet with coordinates or addresses, and the columns you want totalled: beds, residents, insured value, customers.
- A Free, Creator or Creator Max seat.
Before you start
- Say what the bands mean. A footprint file marks its bands with a code. Say which column holds it and what the values are.
- Say "the strongest band it was in". The bands of a swath sit inside each other, so a site in the worst one is inside all three. State the rule and each site is counted once.
- Say the order of the call list. Worst band first, then largest first, is the usual one.
The prompt
We are following up after Hurricane Isaias. Attached are the National Hurricane Center's wind swath for the storm (the RADII field is the wind speed in knots: 34, 50 or 64) and the list of every certified nursing home in Florida, Alabama, Georgia and Mississippi, with address, phone number, beds, average residents per day and coordinates. Tell me which homes were inside the swath, putting each home in the strongest wind area it was in, and for each wind area give the number of homes, the beds and the average residents. Then give me a call list of every home in the hurricane force and 50 knot areas, strongest wind first and then most residents first, with name, city, county, state, beds, residents and phone number. And a map of the homes coloured by the strongest wind they had, with the swath shown.
What to expect
Each site is put in the worst band it was in
Mapstack places the sites from the coordinates in your file and tests each one against the footprint. Every site gets one band, the strongest. In the example 256 of the 1,476 homes were inside the swath:
Wind area Homes Beds Hurricane force (64 knots) 11 1,235 50 knots 31 3,804 Tropical storm force (34 knots) 214 24,476 Outside the swath 1,220 138,520 The totals come from your own columns. Check that the bands add up to your list: here, 1,476 homes.
You get the call list, in your order
The call list is every site in the bands you named, in the order you set, with the columns you asked for. In the example it held 42 homes. The 11 in hurricane-force winds came first: eight in Okaloosa County, Florida, one in Walton County, and two across the state line in Covington County, Alabama.
It is a table in the reply and a dataset you can download for whoever makes the calls.
One map shows the event and the sites
The swath is drawn as nested bands, and each site is coloured by the band it was in. A reader can search for a site by name. Its pop-up gives the columns from your file, including the phone number.
Ask for the map to open on the area that matters. A whole storm track is far larger than the stretch of coast where the damage is.
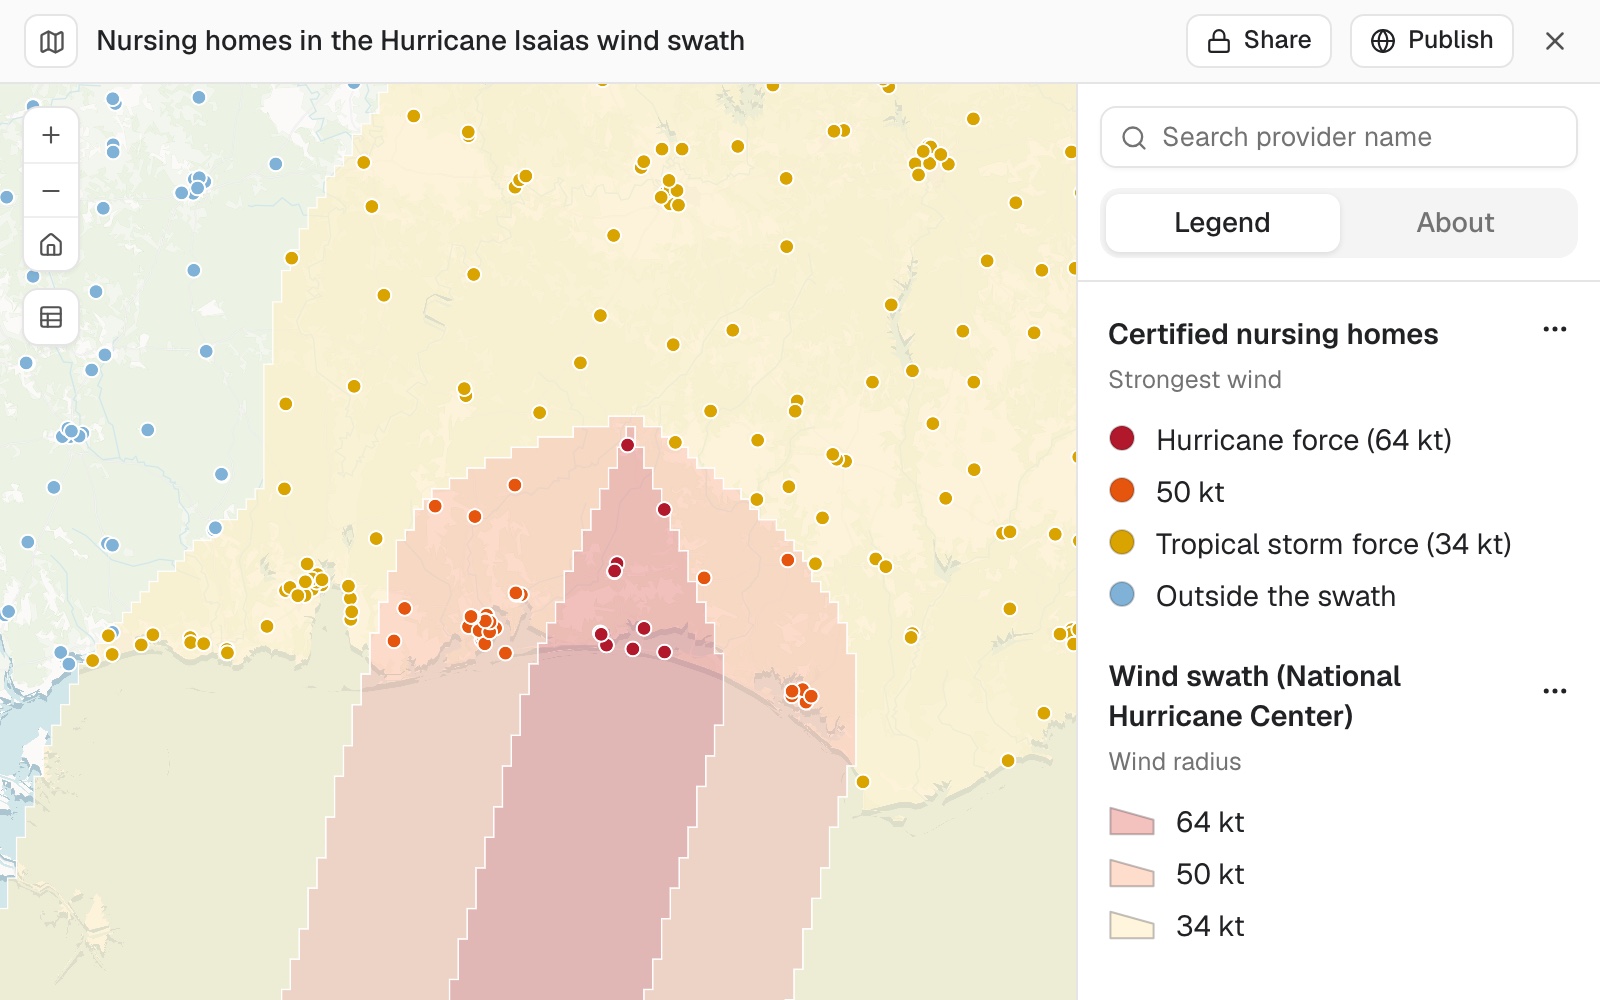 Example: nursing homes on the Gulf coast coloured by the strongest wind of Hurricane Isaias, over the wind swath. The 11 in red had hurricane-force winds and the 31 in orange had winds of 50 knots.
You check a column that looks short
A total is only as good as the column behind it. If one looks low against your own figure, say so, the way you would to a colleague:
The residents look short. Six homes on the call list show a dash, but the file has a figure for each. Take every home's residents from the file as it is and give me the corrected call list.
Mapstack reads the column again, corrects the list and tells you what changed.
You count the people who live inside it
Your sites are one question. Who lives inside the footprint is another, and Mapstack fetches the census for it:
How many people and homes are inside the fire perimeter, and how close did it come to each town?
Census areas rarely match the edge of an event. Where one is cut by it, its people are shared out by the part that falls inside. You get the residents and homes inside, the towns it reached and the distance to the ones it missed.
Make it your own
How many people live inside the hurricane-force area, how many households there have no car, and how many residents are 65 or over?
For each home in the hurricane-force area, which is the nearest hospital by road, and how long is the drive?
Make a one-page briefing sheet of the hurricane-force area with the 11 homes labelled.
Common questions
Where do I get a footprint?
From the agency that tracks the event. Weather services publish wind swaths and flood extents, fire agencies publish perimeters, and emergency managers publish evacuation zones. Download the file and attach it.
The footprint was updated overnight. Do I start again?
No. Attach the new file and ask for the same analysis on it. To have that happen on a timetable, see Re-run last month's analysis on this month's figures.
Can I do this before an event, on a hazard map?
Yes. The method is the same on a flood zone or a fire hazard layer. See Check which of your sites sit in a flood zone.
How do I check the result?
Check that the bands add up to your list, then look at the sites near the edge of a band. A site a short way from the edge can fall either side of it, depending on where its point sits. Ask about any one by name.