

Make the map for the next incident briefing
Turn the latest incident perimeter into a printed briefing sheet with roads, towns, stations, a grid, the datum and the perimeter time.
Best for
Planning and situation staff on a wildfire, flood or other incident who have to print the map for each operational period, and anyone who needs "a map of where it is now" for a briefing. You end up with a print-ready sheet at a set paper size: the perimeter, what is around it, a coordinate grid, the datum, and the date and time of the perimeter, ready to download as a PDF.
The example in this guide uses a real perimeter: the Aspen Acres fire in Custer County, Colorado, from the National Interagency Fire Center's public feed of current wildfire perimeters (one polygon, 102,003 acres, mapped 2 August 2026 at 05:30 UTC, 96% contained). Divisions, drop points and camps are not public, so Mapstack was asked to fetch the stations and towns around the fire instead. The team's own layers are attached the same way as the perimeter. Every ask below was sent with that file, and results vary in the detail from one run to the next.
What you need
- The latest perimeter, as a GIS file (GeoJSON, shapefile, GeoPackage, KML) from the field or the incident's data feed.
- Any of the team's own layers you want on the sheet, such as divisions, drop points or hazards, as files.
- The paper size, and everything the sheet must carry.
- A Free, Creator or Creator Max seat.
Before you start
- Paper sizes. A4, A3, Letter and Tabloid (11×17), portrait or landscape. A larger sheet, such as 36×24, is not made at that size.
- The grid is latitude and longitude. A USNG or MGRS grid is not drawn. Mapstack asks before swapping one for the other.
- One sheet per ask. Each operational period's map is a new ask, with the new files attached.
The prompt
Attached is the latest perimeter for the Aspen Acres fire in Custer County, Colorado. We need the map for tomorrow's 0700 briefing: 11x17 landscape, the perimeter, the roads and towns around it, fire stations within 20 miles, a USNG grid, the datum stated, and the perimeter date and time on the sheet.
What to expect
Mapstack reads the perimeter and fetches what is around it
The perimeter becomes a dataset, with its attributes kept: the acreage, the containment, the time the polygon was mapped and the time the record was last updated. For the stations, Mapstack searched for an open dataset, found the fire and EMS stations in the USGS National Structures Dataset and kept the 31 within 20 miles of the perimeter, each with its distance. The closest, Beulah Valley's station 1, stands inside the perimeter.
Check what it fetched before the sheet goes to the briefing. A station list from open data can be missing a station or still carry one that has moved. If your incident has its own facility list, attach it.
It asks about the grid
A USNG grid is not drawn, so Mapstack stopped and asked: use a labelled latitude and longitude grid (its recommendation), supply a USNG grid layer of your own, or say something else. The example chose Use latitude/longitude grid. The sheet says so in its notes: "Grid: WGS 84 latitude/longitude; not USNG."
You get the sheet
An 11×17 landscape GIS sheet: the perimeter in red over a base map with roads, the stations (the nearest named), a latitude and longitude grid round the frame, a scale bar in miles and kilometres, a north arrow, a key, the scale ("1:400,000 at Tabloid. Print at 100%."), a status box, the date, the datum and the sources. The perimeter's recorded and updated times are printed under the title.
Mapstack kept the times from the data rather than the briefing hour. Because the perimeter was months old on the day, it also labelled it a historical perimeter, "not a current operational boundary". With a perimeter from this morning's flight, check what the sheet says about it.
You add what the briefing needs
Add the acreage and containment from the file to the title block, and label the nearest towns with their distance from the perimeter.
Mapstack fetched Colorado's census places and labelled the 21 within 25 miles with their straight-line distance from the perimeter: Rye 0.52 miles, Pueblo West 10.07, Florence 10.86, Westcliffe 18.40, and two, Beulah Valley and Colorado City, whose boundaries touch the fire at 0. The title panel carries the acreage and containment: "Aspen Acres · 102,003 acres · 96% contained".
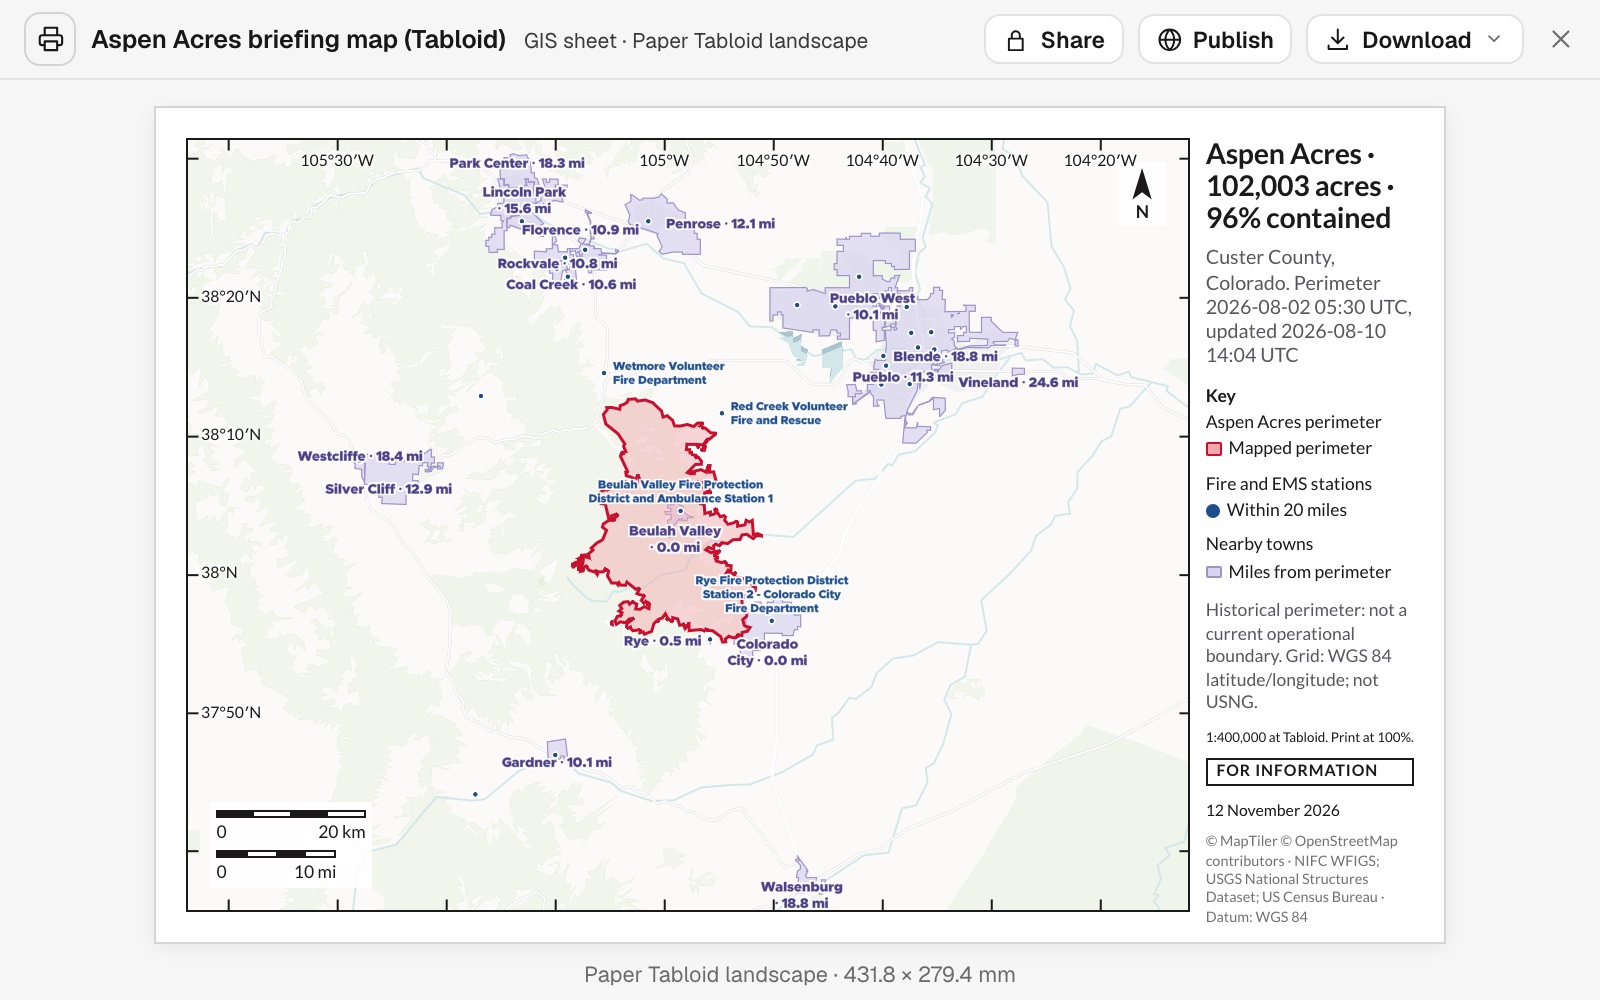 Example: the 11×17 briefing sheet, with acreage and containment in the title, nearby towns labelled with their distance, and the stations within 20 miles.
Common questions
Can I get a 36×24 plot for the briefing room?
Not at that size. Sheets go up to Tabloid (11×17) or A3. Asked for 36×24, Mapstack made an A3 landscape version with the same content and suggested scaling the PDF up on the plotter. The scale statement is for the sheet as made, so check it after scaling.
Can I have a USNG or MGRS grid?
Not drawn: the grid is latitude and longitude, and Mapstack asks before using it in place of the one you named. Supply a USNG grid layer as a file, or brief with the latitude and longitude grid; the sheet states which grid it carries.
Which date and time go on the sheet?
The perimeter's own recorded and updated times, taken from the file and printed under the title, not the time of the briefing. In the example the perimeter was months old, and the sheet labelled it a historical perimeter; with this morning's perimeter, read what the sheet says about it.
Can I change what the sheet shows or names?
Yes. Ask for the item by name, for example "Label the nearest towns with their distance from the perimeter." The sheet is redrawn with the rest kept. Mapstack names the closest stations and leaves the rest as symbols so labels do not crowd; say which ones must be named.
How do I make the next operational period's map?
Send a new ask with the new perimeter and layers attached. Each sheet is one ask, so say the paper size and everything the sheet must carry.