

Make a study-area figure for a journal paper
Turn your study sites into a journal study-area figure with sized symbols, rivers, a locator inset, scale bar, north arrow and sources.
Best for
Researchers and students who need the study-area map for a paper, a thesis or a poster: where the sites are, what they measure, and where in the world this is. You end up with a one-page figure carrying the furniture reviewers expect (sized symbols, a key, a locator inset, a scale bar, a north arrow and the data sources), downloaded as a PDF or PNG.
The example in this guide is a real file of study sites: the 30 USGS stream gauges in the Yampa and White river basins (Colorado, Wyoming and Utah) with a daily flow record running to October 2026 or later, taken from the USGS Water Data APIs. Each row has a site number, a name, the state and county, the drainage area in square miles, the altitude and the coordinates. One gauge has no drainage area. Every ask below was sent with that file, and results vary in the detail from one run to the next.
What you need
- Your sites, as a spreadsheet with coordinates or addresses, or a GIS file.
- The journal's figure rules: the width, the resolution and what must be on the figure.
- A Creator or Creator Max seat. Prints are made on paid seats.
Before you start
- A figure with a scale bar, north arrow and locator is a GIS sheet, and a GIS sheet is on paper. It comes at A4, A3, Letter or Tabloid, not at a column width such as 85 mm. Plan to download the PDF and set it to the column width in your layout or drawing software.
- Name everything the figure must carry. What you name is put on the page; what you leave out, Mapstack decides. Name the rivers or boundaries you want drawn, too, or the base map may be left to show them.
The prompt
These are the 30 stream gauges in my study of the Yampa and White river basins (Colorado, Wyoming and Utah). I need the study-area figure for the paper: single column, 85 mm wide, gauges sized by drainage area, the main rivers, an inset locator showing where this is in the western US, a scale bar, a north arrow, colour-blind-safe colours and the data sources.
What to expect
Your sites become a dataset, and Mapstack designs the sheet
The file is kept as a dataset you can open and check. Mapstack then lays out a GIS sheet: the gauges as circles sized by drainage area in a colour that avoids red–green contrasts, a key, a scale bar in kilometres and miles, a north arrow, a locator inset, the date and the credits. A gauge with no value stays on the map as a small grey circle, listed in the key as No value, so no site disappears.
It says where it departed from the brief. In the example it made an A4 landscape sheet rather than an 85 mm figure, left the rivers to the shaded-relief base map rather than drawing them, and used its regional locator rather than a western US view. Because the map covers parts of three states, the sheet carries a scale bar and states "No scale stated: it varies across this map" instead of a ratio.
You ask for the width, and learn the route to it
The journal needs it as a single-column figure 85 mm wide, not an A4 sheet. Make it at that width, keeping the inset, scale bar, north arrow and sources legible at that size.
Mapstack does not make a print at a custom width. It explained that the paper sizes are the only ones a GIS sheet comes in, that shrinking an A4 sheet to 85 mm makes the text too small to read, and that the smaller figure formats (80 mm is the nearest) do not carry a scale bar, north arrow or inset. Its suggestion: download the PDF and set the width and type sizes in Illustrator or Inkscape, or ask for a portrait sheet with larger symbols and text so it shrinks better.
You add what reviewers will look for
Label the six gauges with the largest drainage area by their site number, small enough to stay legible at print size.
Reviewers will want the rivers themselves: draw the Yampa, Little Snake, White and Green rivers as blue lines, and make the locator inset show the whole country so readers can place the basins.
Mapstack picked the six gauges from the file (7,931 down to 2,530 square miles, the same six the file gives), labelled them in 8 pt with a white halo, fetched the four rivers from the USGS National Hydrography Dataset, drew them under the gauges, widened the inset and added the new sources to the credits.
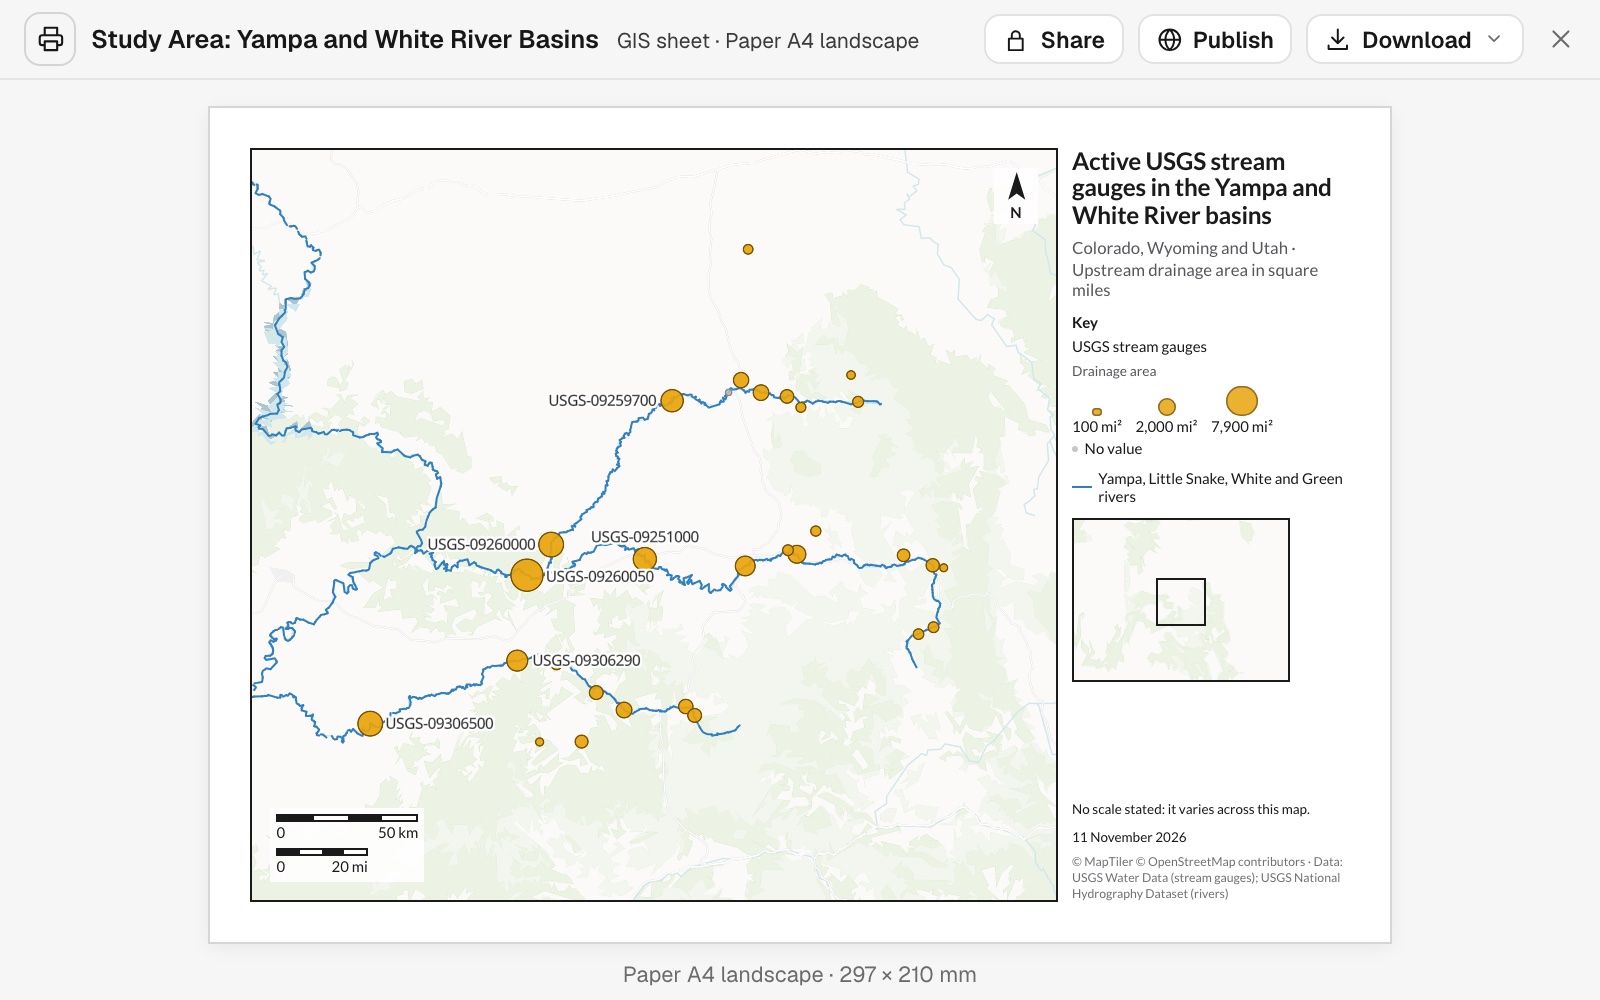 Example: the A4 study-area figure after the follow-ups: all 30 gauges sized by drainage area, the six largest labelled by site number, the four rivers drawn, and the locator inset.
You check every site and label made it onto the page
Look along the edges of the frame and under the scale bar and inset. In the example one of the six labelled gauges sat at the corner of the frame under the scale bar, and its label was missing. Name it and say what to do:
USGS-09306500, White River near Watson, sits at the bottom-left edge under the scale bar and its label is missing. Move the scale bar or widen the frame so every gauge and all six labels show.
Mapstack widened the frame to the west and south, and all 30 gauges and the six labels showed.
You download it for the journal
The journal wants at least 300 dpi. What can I download it as, and at what resolution?
Select Download on the print, then Download PDF or Download PNG. The PDF is the sheet at its true paper size with real text; place it in your manuscript, or open it in drawing software to set the width and export the file type the journal asks for. There is no TIFF download.
Common questions
Can I get it at the journal's column width, such as 85 mm?
Not directly. A sheet with a scale bar, north arrow and inset comes at A4, A3, Letter or Tabloid, so download the PDF and set the width in your layout or drawing software. If it has to shrink a long way, ask for "a portrait sheet with larger symbols and text so it shrinks better".
Can it draw the rivers, rather than leave them to the base map?
Yes. Name them: "Draw the Yampa, Little Snake, White and Green rivers as blue lines." In the example Mapstack fetched them from the USGS National Hydrography Dataset, drew them under the gauges and added the source to the credits.
Can I get it as TIFF?
No. Download the PDF or PNG and convert it in an image or drawing program. The PDF is the sheet at its true paper size, with real text.
How do I check the figure before I submit it?
Look along the edges of the frame and under the scale bar, key and inset, where a site or a label can be hidden. Name any that are missing and say what to do, for example "Move the scale bar or widen the frame so every gauge and all six labels show."