10 free datasets tagged “neighborhood”. Open any one in Mapstack — no GIS skills, no download.
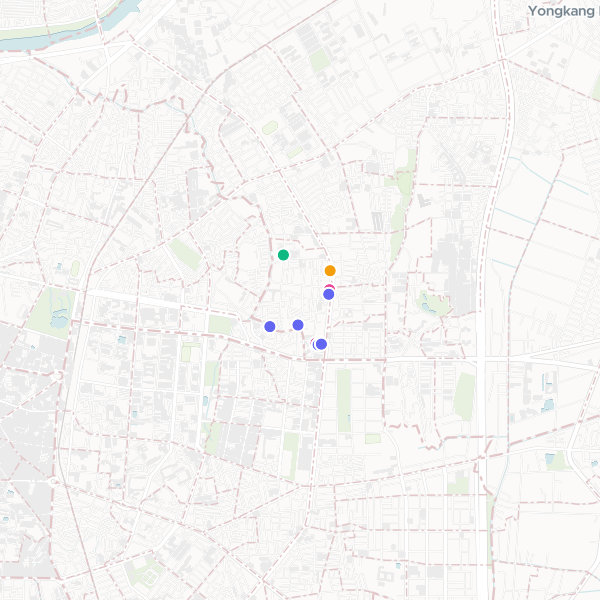
Shops and Cafes in Shengli Neighborhood
Local shops and cafes in the Shengli Neighborhood, including coffee shops, bakeries, and boutique stores.
10 features
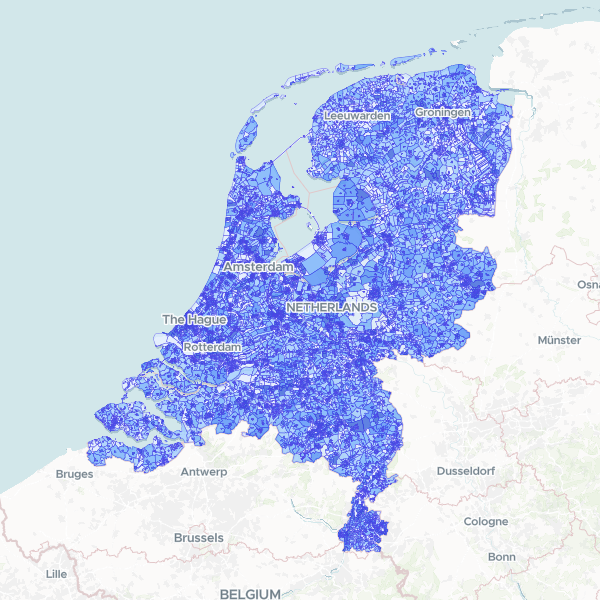
Netherlands Neighborhood Population 2025
Total population and population by age group (0-15, 15-25, 25-45, 45-65, 65+) at neighborhood (buurt) level for the Netherlands in 2025. Normalize counts using the Total Population column for demographic shares. Total Population is provided as a denominator.
14,727 features
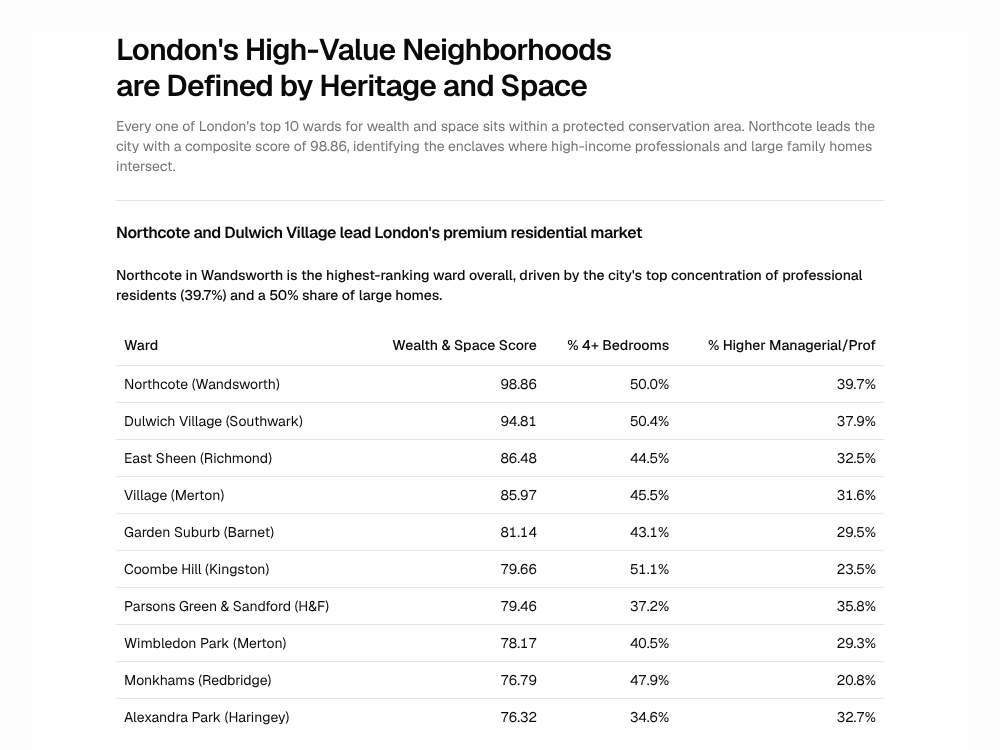
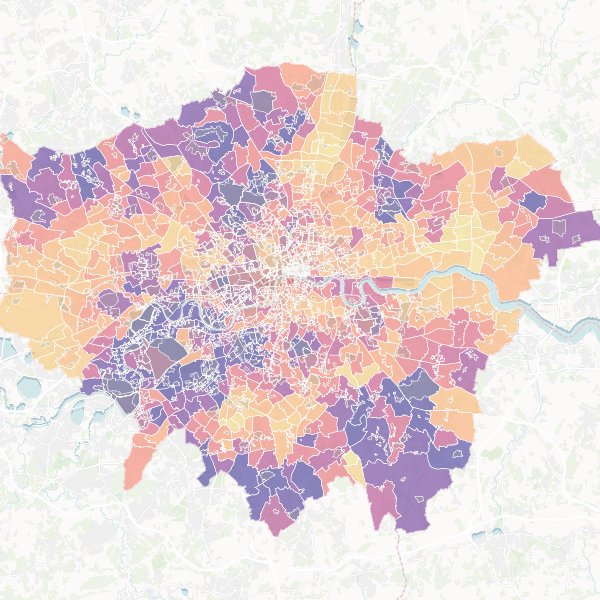
London's Premium Neighborhoods: Space, Wealth, and Heritage
Every one of London's top 10 wards for wealth and space sits within a protected conservation area. Northcote leads the city with a composite score of 98.86, identifying the enclaves where high-income professionals and large family homes intersect.
Report
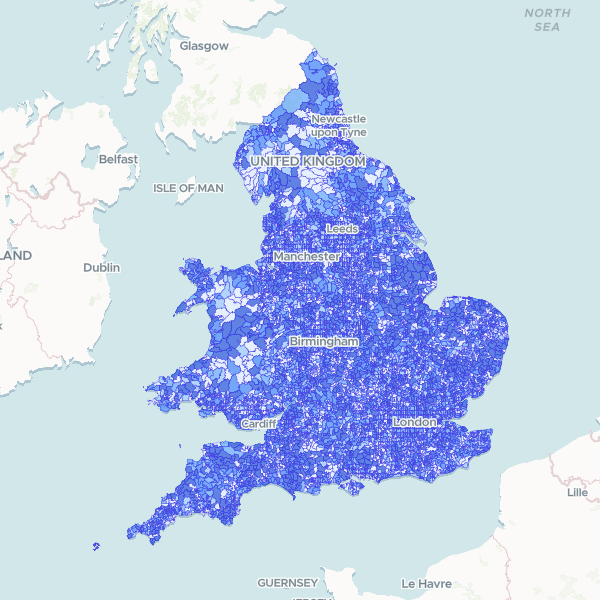
England and Wales population by LSOA
Census 2021 full-count population total by Lower layer Super Output Area (LSOA). Note: Coverage is restricted to England and Wales.
35,672 features
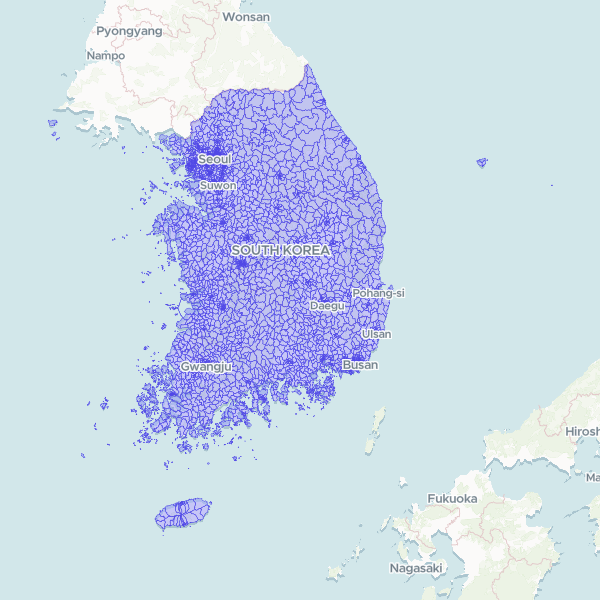
South Korea Towns and Neighborhoods (행정 읍면동) 2025
Official sub-municipal administrative boundaries of South Korea — 3,559 eup/myeon/dong units (the administrative hierarchy used for census statistics, not the legal-district hierarchy). Statistics Korea SGIS census boundaries, base date 30 June 2025, SGIS statistical codes. Generalised for web delivery.
3,559 features
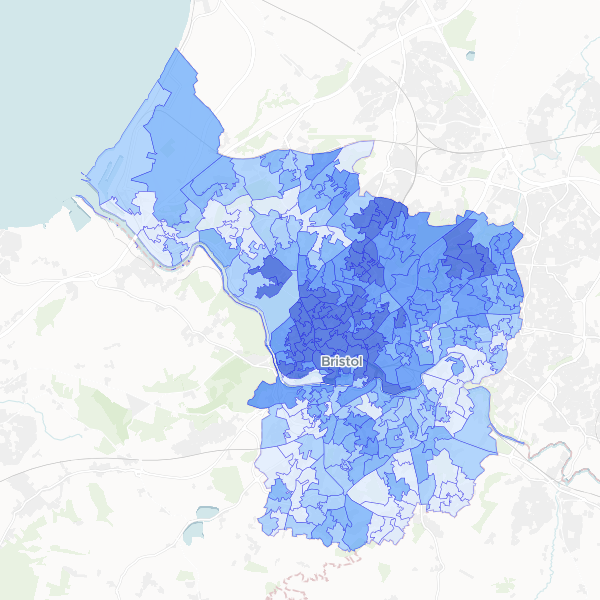
Full-time student concentration in Bristol by LSOA
Full-time students as a proportion of total population at LSOA level in Bristol.
268 features
London: Premium Properties & Conservation Areas
A guide to London's premium neighborhoods, identifying wards with large family homes and high-income residents in close proximity to conservation areas. Top candidates include Northcote, Dulwich Village, and East Sheen.
Map
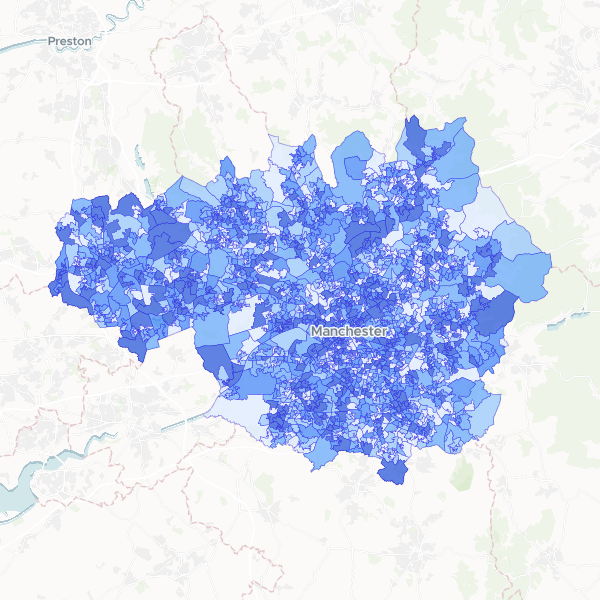
Deprivation by LSOA in Greater Manchester
Households by number of deprivation dimensions in Greater Manchester. Deprivation is defined based on four dimensions: employment, education, health and disability, and housing. Normalise using Total Households to compute the proportion of households in each deprivation category.
1,702 features
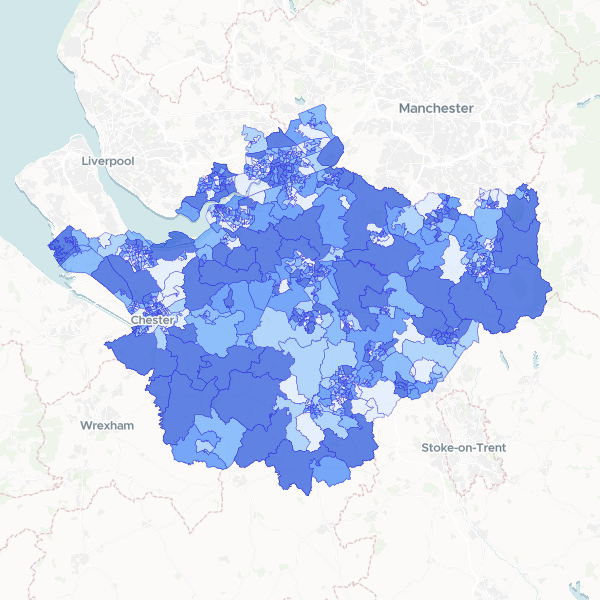
Household deprivation in Cheshire by LSOA
Households by number of deprivation dimensions in Cheshire (Census 2021, full count). Includes total households and number of households deprived in zero, one, two, three, or four dimensions, used here as a proxy for affluence.
678 features
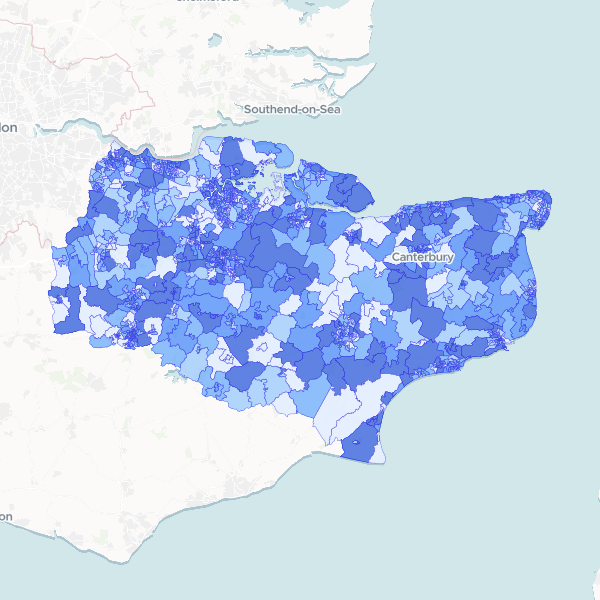
NS-SeC by Kent LSOA
Socio-economic status (NS-SeC) breakdown by LSOA for Kent, using 2021 Census data. Contains counts for all occupational categories and the total residents aged 16+. Full-count data.
1,105 features