13 free datasets tagged “income”. Open any one in Mapstack — no GIS skills, no download.
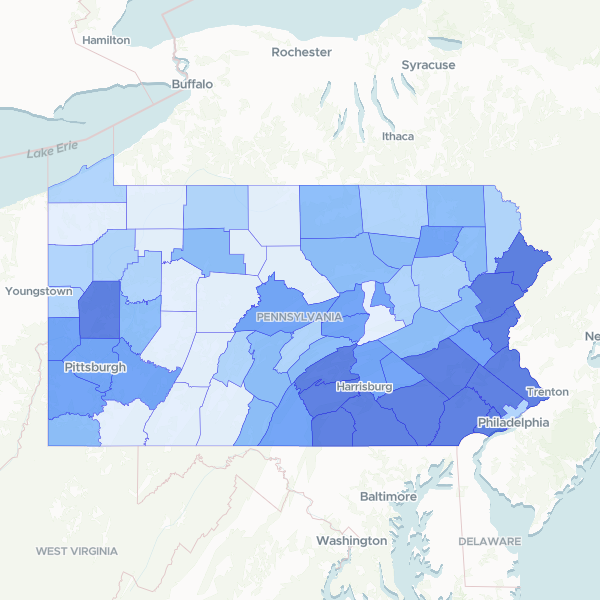
Pennsylvania Median Household Income by County
Median household income in the past 12 months in 2023 inflation-adjusted dollars, derived from the 2023 5-Year American Community Survey.
67 features
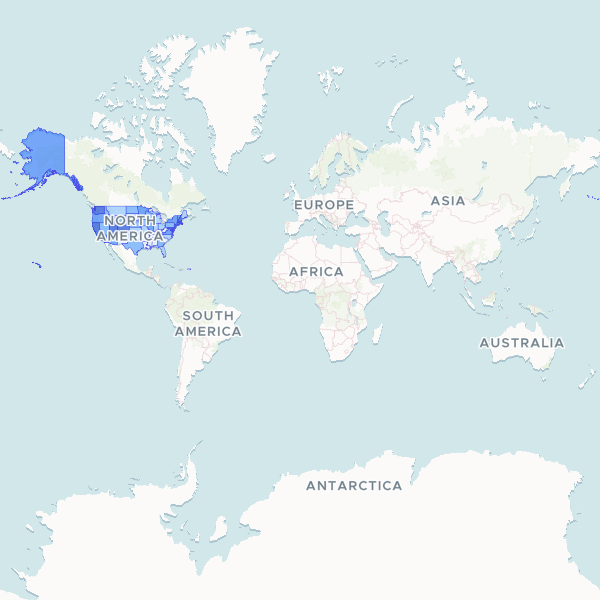
Median Household Income by State
Median household income in the past 12 months for 50 states, DC, and Puerto Rico, based on 2023 ACS 5-year estimates. This dataset uses sample-based estimates, which carry margins of error; margins are not included in this dataset. Median values should not be summed across areas.
52 features
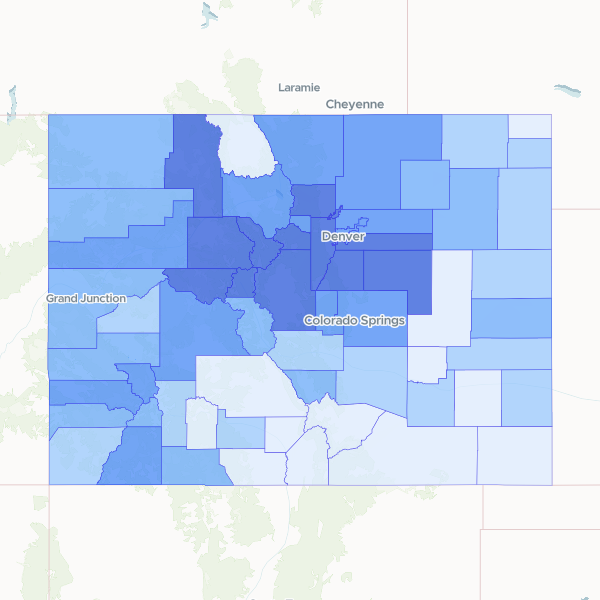
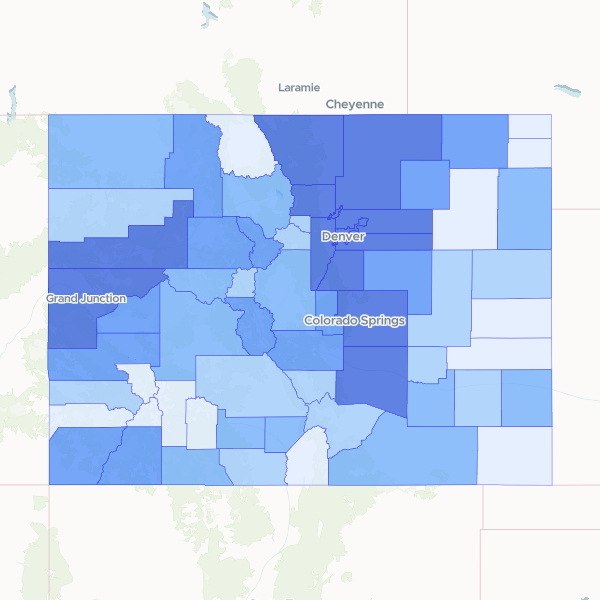
Colorado Median Household Income by County
Median household income by county for Colorado, based on the 2023 5-year American Community Survey. Household income is in 2023 inflation-adjusted dollars. Margin of error attributes are separate and excluded.
64 features
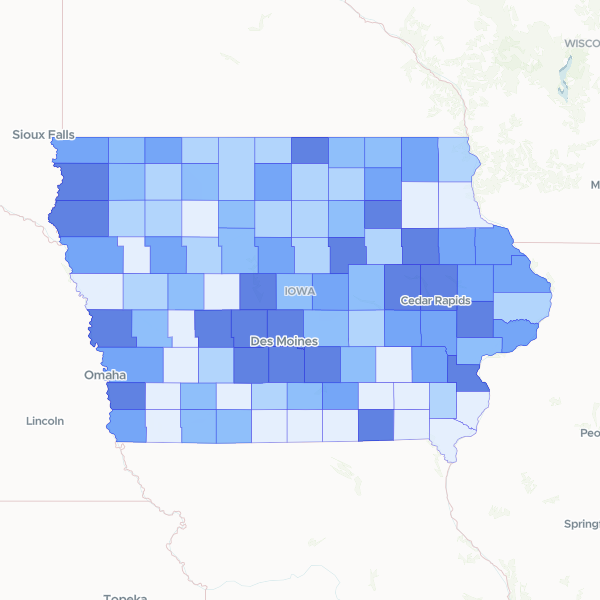
Iowa Median Household Income by County
Median household income in the past 12 months (in 2023 inflation-adjusted dollars) for Iowa counties.
99 features
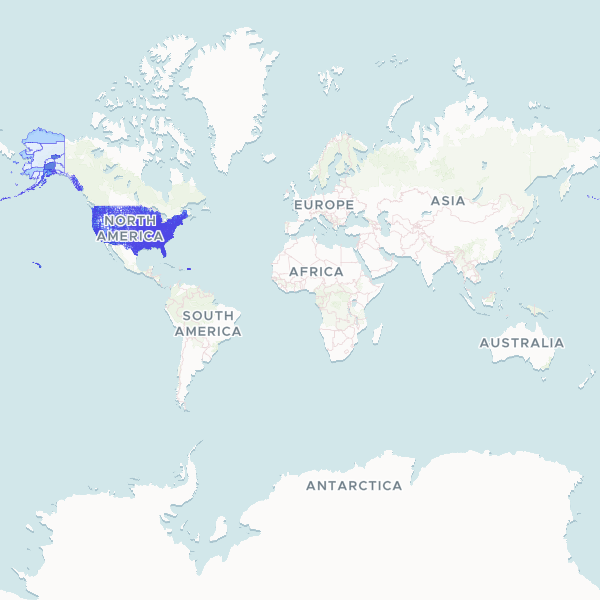
US county poverty status by population
Counts of individuals below poverty level and at or above poverty level, with total population for whom poverty status is determined, by US county, from the 2023 5-year American Community Survey. Normalize using Total Population for Poverty Status. This is a sample survey estimate, not a full count. Every value carries a margin of error (available separately).
3,222 features
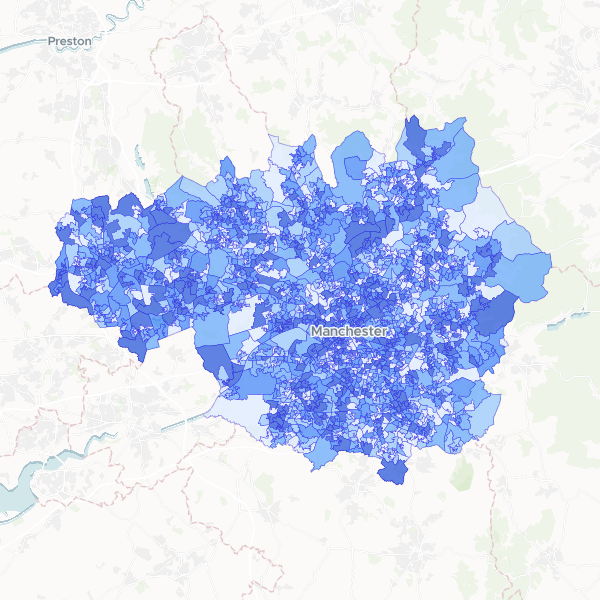
Deprivation by LSOA in Greater Manchester
Households by number of deprivation dimensions in Greater Manchester. Deprivation is defined based on four dimensions: employment, education, health and disability, and housing. Normalise using Total Households to compute the proportion of households in each deprivation category.
1,702 features
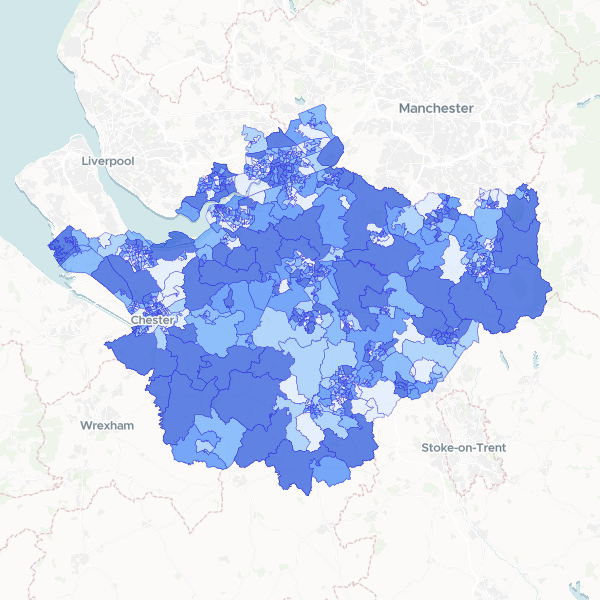
Household deprivation in Cheshire by LSOA
Households by number of deprivation dimensions in Cheshire (Census 2021, full count). Includes total households and number of households deprived in zero, one, two, three, or four dimensions, used here as a proxy for affluence.
678 features
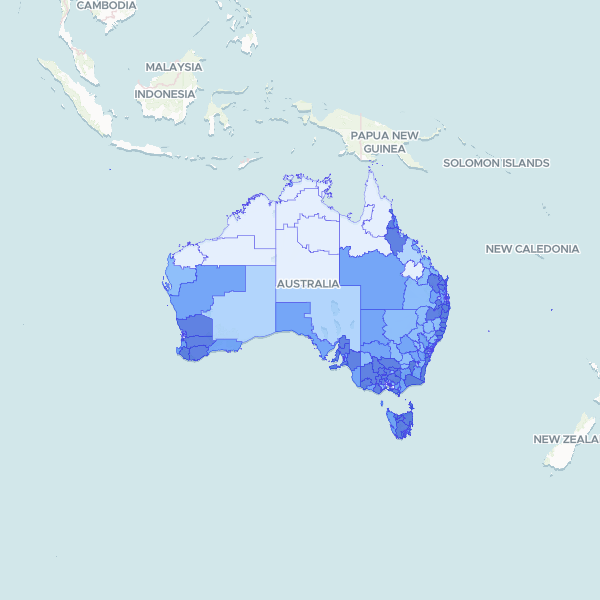
Australia Resident Profile by Statistical Area Level 3 (Medians)
Key demographic metrics: Median Age and Median Total Personal Income (Weekly) from the 2021 ABS Census at the Statistical Area Level 3 (SA3) level. Data is a full count from the Census 2021 General Community Profile. Tourism Regions were requested; SA3 level was chosen as an alternative.
340 features
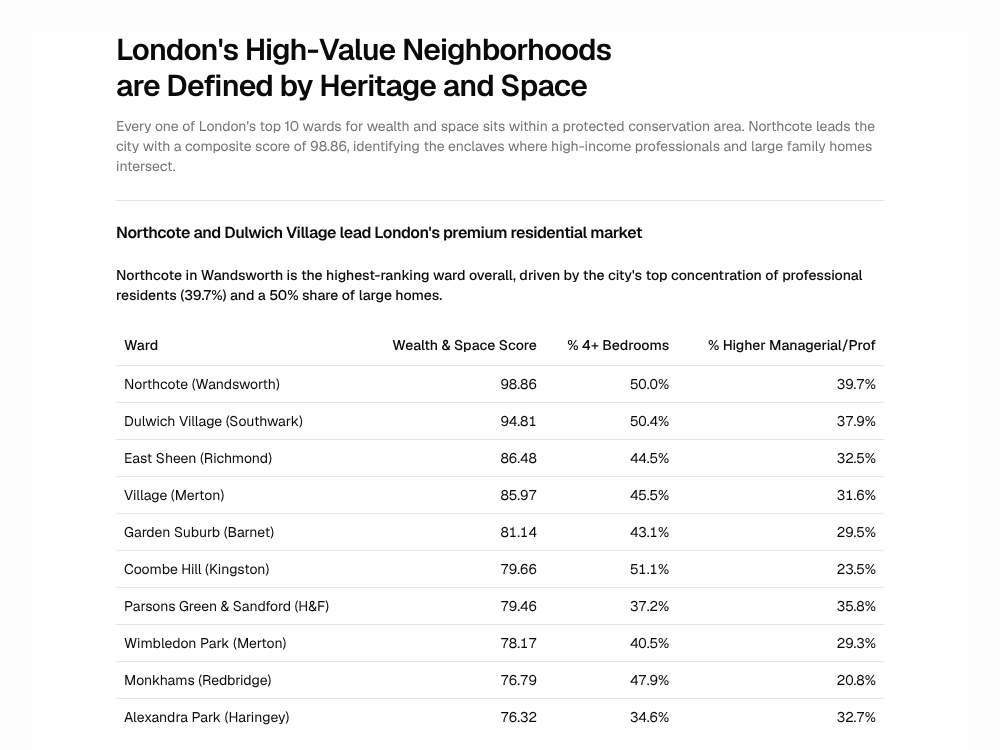
London's Premium Neighborhoods: Space, Wealth, and Heritage
Every one of London's top 10 wards for wealth and space sits within a protected conservation area. Northcote leads the city with a composite score of 98.86, identifying the enclaves where high-income professionals and large family homes intersect.
Report
Colorado Population by County
Total population by county for Colorado, based on the 2023 5-year American Community Survey. Note: These are survey estimates, not a full count. Population density cannot be directly calculated from this dataset alone as it lacks land area in square miles. Household income is in 2023 inflation-adjusted dollars. Margin of error attributes are separate and excluded.
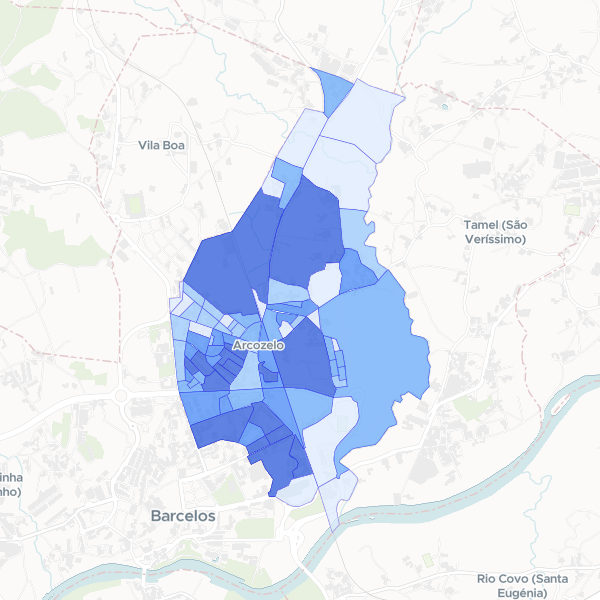
Arcozelo population breakdown 2021
2021 Census synthesis population breakdown by sex and age for Arcozelo (subseccao). Note: Income, education, and employment data are absent from this collection.
81 features
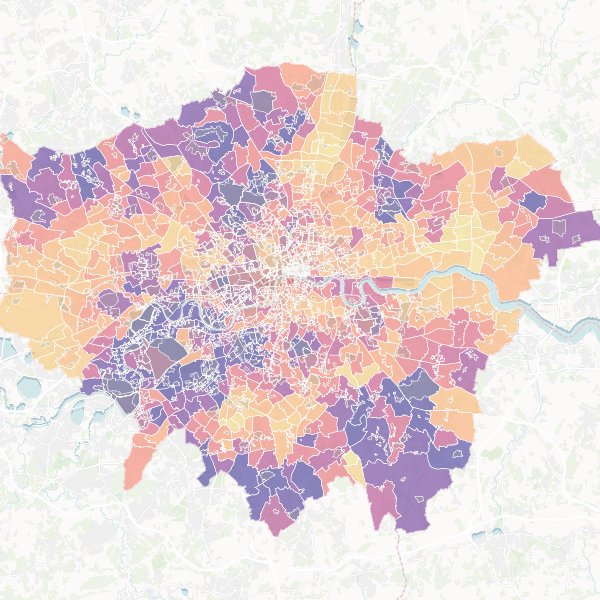
London: Premium Properties & Conservation Areas
A guide to London's premium neighborhoods, identifying wards with large family homes and high-income residents in close proximity to conservation areas. Top candidates include Northcote, Dulwich Village, and East Sheen.
Map
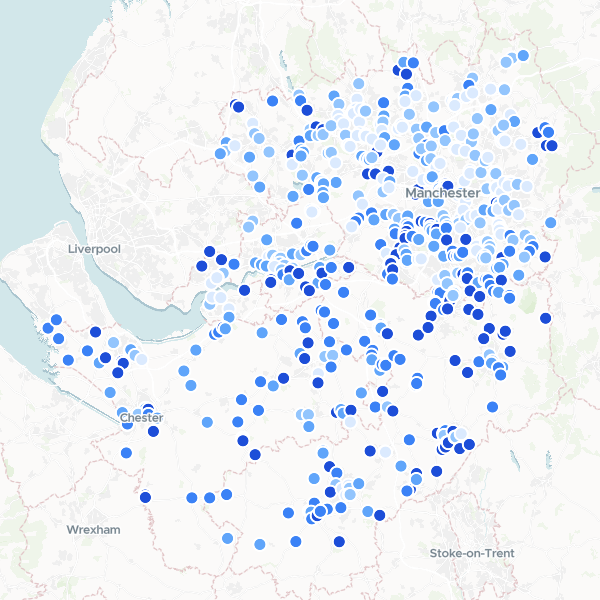
Garden Centres in Manchester and Cheshire by Affluence
A ranked list of garden centres and florists across Greater Manchester and Cheshire, enriched with local affluence data. The dataset combines business locations with census-based household deprivation statistics to identify retail sites in high-income areas.
627 features